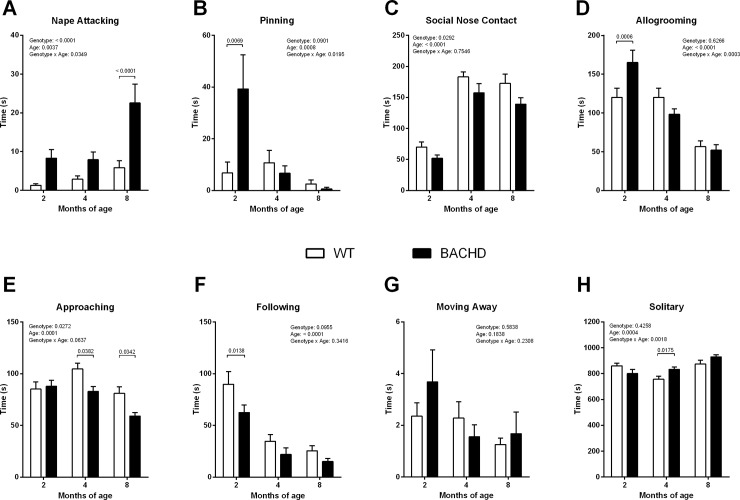
Fig 2. Social interaction test.
(A) Nape Attacking. (B) Pinning. (C) Social Nose Contact. (D) Following. (E) Approaching. (F) Allogrooming. (G) Moving Away. (H) Solitary. Data are expressed as means + S.E.M. Two-way ANOVA results are displayed above each graph. Results from post-hoc analysis are indicated on the graph in case significant genotype differences were found. N = 12 pairs of WT and 12 pairs of BACHD rats.

