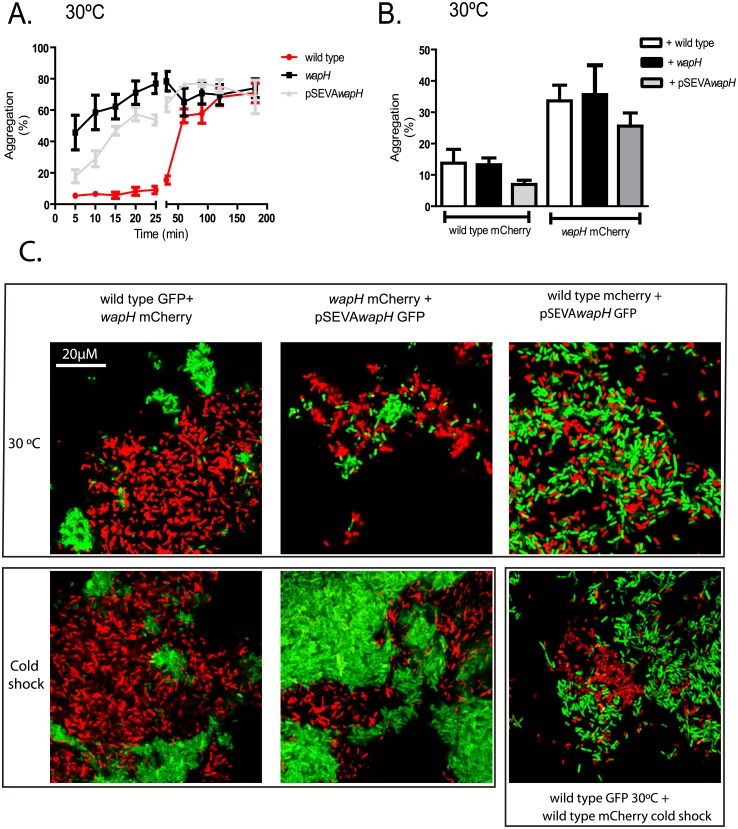
Fig 2. Aggregation assays.
A. Aggregation assay at 30°C of the wild type (wt), wapH and complemented strain (pSEVAwapH). Values represent mean ± SD of 5 independent measurements. B. Aggregation assay with different strains expressing mCherry protein and mixed with an unmarked strain. Values represent media ± SD of 5 independent measurements. C. Microscopic visualization of mixed aggregates using cells grown at 30°C or from cold shock experiments. Strains expressing fluorescent proteins were mixed and settled for15 min. An aliquot from the bottom of the tube was taken and aggregates were observed in a confocal microscope using 1000X magnification. Representative images from triplicate independent experiments are shown.

