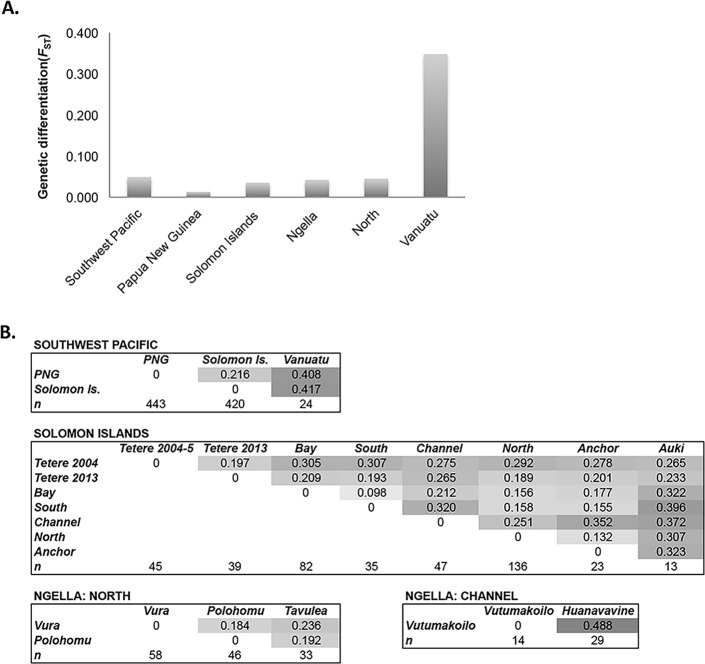
Fig 3. Genetic differentiation of Plasmodium vivax populations across the Southwest Pacific.
(A) Average genetic differentiation among subpopulations. Average F statistics (FST) was measured over all loci for all regions with at least two sub-populations of 20 or more samples, with the exception of Vanuatu, which had three populations of 7–10 samples. (B) Pairwise genetic differentiation between subpopulations. Pairwise differentiation was measured using Jost’s D, which accounts for the high diversity of microsatellite markers [58]. Values are shown for populations at different spatial scales. Darker shading indicates higher values.

