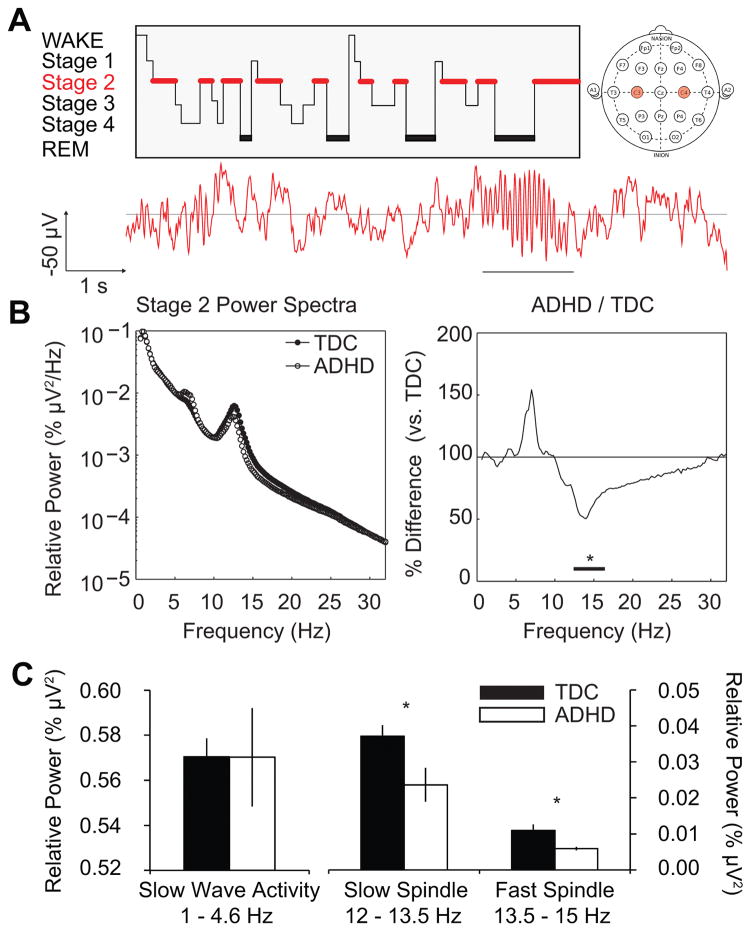
Figure 1. All-night NREM Stage 2 Power Spectra.
(A) Top-Left: A schematic “hypnogram” (redrawn and adapted from (Abel, Havekes, Saletin, & Walker, 2013)) demonstrating a prototypical night of sleep, as staged by polysomnography. Red highlights NREM Stage 2 sleep, from which all EEG analyses derive. Top-Right: A pictorial depiction of the standard electrode placements for EEG. Power spectra are averaged for the left and right central derivations (C3 and C4, labeled in red), respectively, corresponding to primary motor cortex. Bottom: Representative 10-seconds of Stage 2 NREM EEG. Time and amplitude scale as indicated. Underlined portion highlights a prototypical sleep spindle frequency event. (B) Left: Relative EEG power during Stage 2 sleep for the typically developing controls (black circles) and ADHD group (white circles), respectively from 0.6 Hz to 32 Hz at 0.2 Hz resolution (frequency on abscissa). Each participant’s power spectrum is normalized to his or her total power across this range yielding relative (%) values, plotted here on a base-10 logarithmic scale. Right: Stage 2 power in the ADHD group plotted as a percentage of the typically developing group; frequency axis as before. Black bar indicates frequencies of significant difference between groups. (C) Integrated Stage 2 power extracted for the slow wave, slow spindle, and fast spindle bands, respectively, using a priori frequency definitions. Significance values are derived from appropriate statistics reported in the text and are indicated as: + = p < 0.10, * = p < 0.05.

