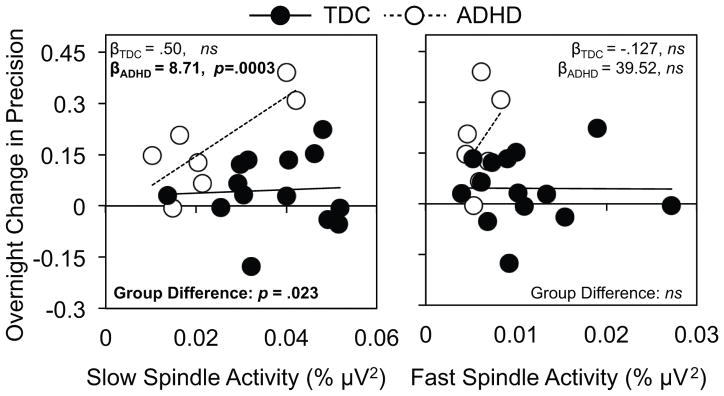
Figure 3. Association between EEG spindle activity and overnight precision gains.
Scatterplots of the association between individual levels of slow (12–13.5 Hz; left) and fast (13.5–15 Hz; right) spindle activity during NREM Stage 2 sleep and overnight change in MST precision (proportion of keystrokes not associated with errors). Lines of best fit for the TDC group (black circles) are plotted as solid lines with those for the ADHD group (white circles) plotted as dotted lines. Group-wise simple slopes and the difference between these slopes are extracted from the regression models reported in the text. ns = p > 0.05.

