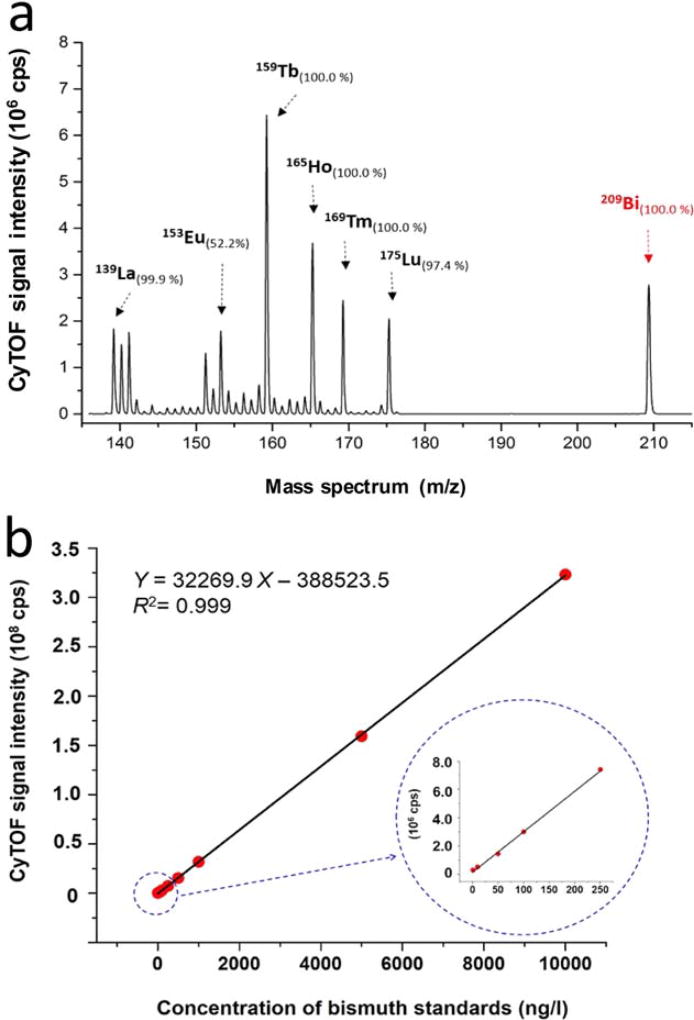
Figure 2.
Mass spectrum and quantitatively dynamic range of bismuth via CyTOF. (a) CyTOF mass spectra of 13 natural abundance lanthanide elements and 100% abundance bismuth at concentrations of 100 ng/l in 2% HNO3. (b) The CyTOF signal intensities are plotted vs. concentrations of bismuth standards. The dynamic range of quantification of bismuth is linear over four orders of magnitude ranging from 1 to 10,000 ng/l. All measurements were carried out in solution-mode CyTOF analysis

