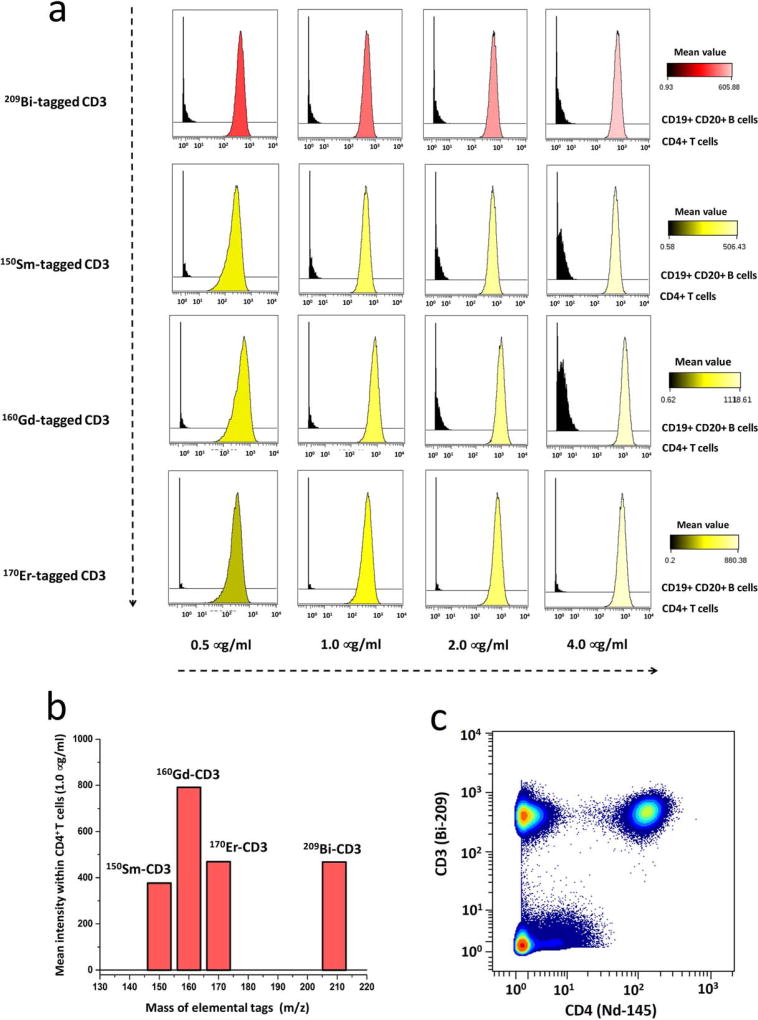
Figure 5.
Comparison of analytical sensitivity of bismuth- and lanthanide-tagged CD3 antibodies. (a) CyTOF titration histograms of 209Bi-, 150Sm-, 160Gd-, or 170Er-tagged CD3 antibody. The stained cells are human PBMCs, with positive control of CD4+ T cells and negative control of CD19+ CD20+ B cells. The concentrations of conjugated CD3 antibodies were 0.5, 1.0, 2.0, and 4.0 µg/ml. (b) Bar graphs of mean intensity of each conjugated CD3 antibody at the concentration of 1.0 µg/ml in the subset of CD4+ T cells. (c) Biaxial scatter plots of 209Bi-tagged CD3 antibody vs. 145Nd-tagged CD4 antibody within human PBMCs at the optimal concentration of 1.0 µg/ml.

