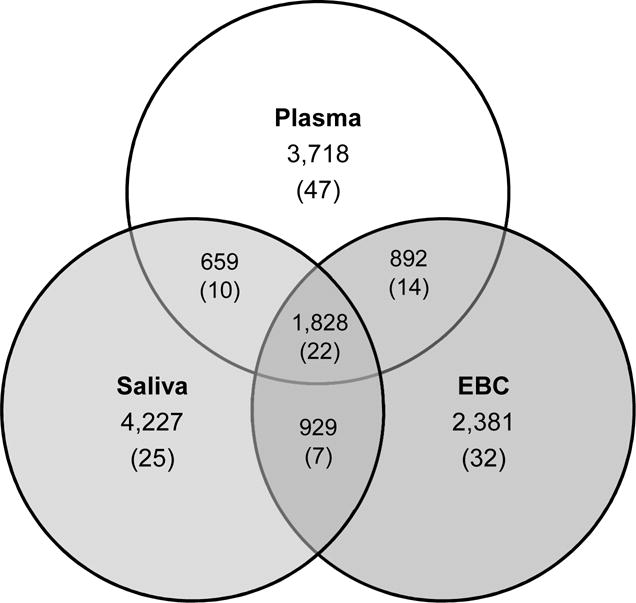
Figure 1.

Venn Diagram of Feature Counts. Counts are from features detected at any sampling time. Features in one matrix were matched to features in another if they were within 10ppm of their respective m/z and within 30s of retention time. The numbers in the parentheses indicate the counts of features from the USEPA Master List of Mobile Source Air Toxics.
