Fig. 4.

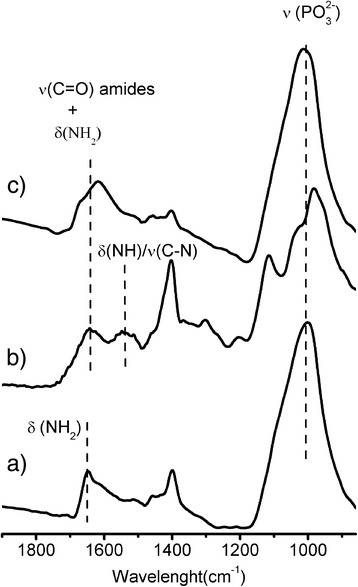
FT-IR characterization of functionalized MNPs. FT-IR spectral region in the 850–1900 cm−1 range of a) NH2@MNPs, b) gH625@MNPs, and c) PEG,FA@MNPs

FT-IR characterization of functionalized MNPs. FT-IR spectral region in the 850–1900 cm−1 range of a) NH2@MNPs, b) gH625@MNPs, and c) PEG,FA@MNPs