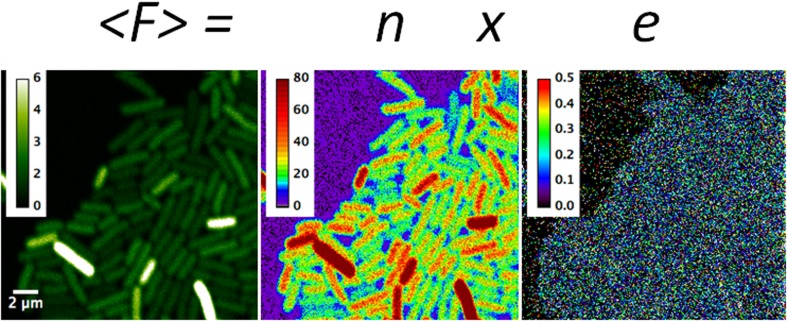
Fig. 1.
Example of scanning number and brightness (sN&B) analysis: expression of a highly fluorescent mutant of the green fluorescent protein (GFPmut2) from a promoter fusion in Bacillus subtilis. The average fluorescence from 50 rapid raster scans (<F>; in counts per dwell-time) at each pixel in the average image is equal to the number of molecules in the effective excitation volume at that pixel, n, times their molecular brightness, e [counts/(dwell-time × molecule)]. These values have been calculated using Eqs. (3) and (4) and are hence corrected for shot noise. Data were from Ferguson et al. (2011). The intensity scale on the left is 0–6 average photon counts per 40 μs dwell-time. The scale for n is 0–80 molecules present on average in the effective excitation volume. The scale in e is 0–0.5 photon counts per dwell-time per molecule. In this case the average for pixels inside bacterial cells (only the central 50% of pixels in each cell are used to avoid edge effects) was 0.05 counts per 40 μs dwell-time per molecule. Full x–y scale is 20 × 20 μm

