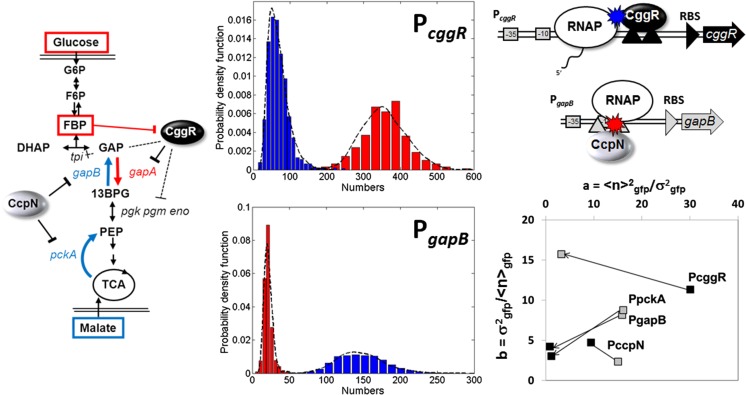
Fig. 2.
Mechanisms controlling biological noise in a gene expression network deduced from sN&B analysis. Left: Pathway for glycolysis and gluconeogenesis in B. subtilis. Expression of the gapA operon is repressed by CggR when cells are grown on malate, whereas expression of the pckA and gapB promoters is repressed by CcpN in cells grown in glucose medium. Middle: Histograms of the number of green fluorescent protein (GFP) molecules in the excitation volume expressed from the PgapB (bottom) and the PcggR(gapA) (top) promoters, as noted, in glucose (red) and in malate (blue). Note the difference in scales on the x-axes. Also, note that the histograms are not corrected for contributions from auto-fluorescence. Once this was done, the average number of molecules of GFP in the excitation volume expressed from PgapB was only 3 on average. Given the size of the volume (0.07 fL) this corresponds to a concentration of 20 nM. Top, right: The Road Block mechanism for Cggr repression of PcggR and the Hold Back mechanism for CcpN repression of PgapB . Schematics and data are from Ferguson et al. (2012). Bottom right: Noise characteristics for the three promoters, plus that of PccpN, which is known not to change between glucose and malate

