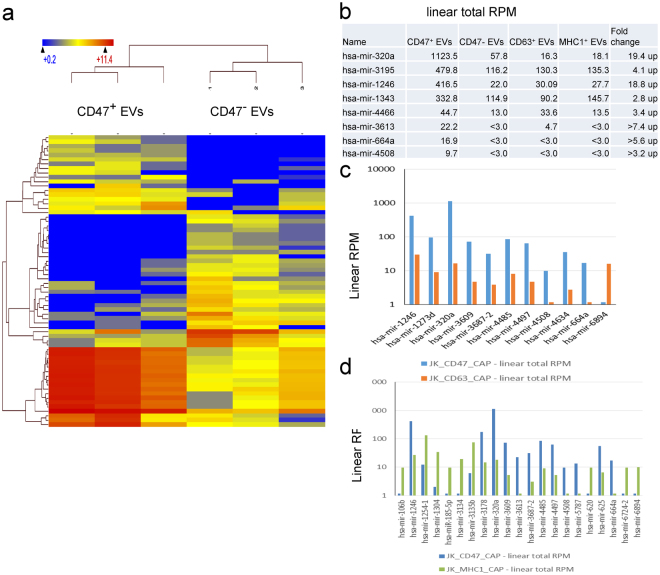
Figure 7.
Micro-RNA enrichment in captured EVs determined by RNAseq. (a) Heat map of hierarchical clustering of 109 miRNAs (All species) differentially enriched in CD47+ versus CD47− EVs at p < 0.05. (b) 27 miRNAs were upregulated, and 5 hsa-miRNA are enriched only in CD47+ EVs. (c) A comparison of CD47+ and CD63+ EVs shows differential expression of 100 miRNAs (All species) at p < 0.05 using log base 2 of total RPM, (CD47_CAP and CD63_CAP with Student’s t-test), and 11 hsa-miRNAs are presented in the graph. (d) A comparison of CD47+ and MHC1+ EVs shows differential expression of 112 miRNAs (All species) at p < 0.05 using log base 2 of total RPM (CD47_CAP and YCD63_CAP with Student’s-test), and 21 hsa- miRNA are presented in the graph.

