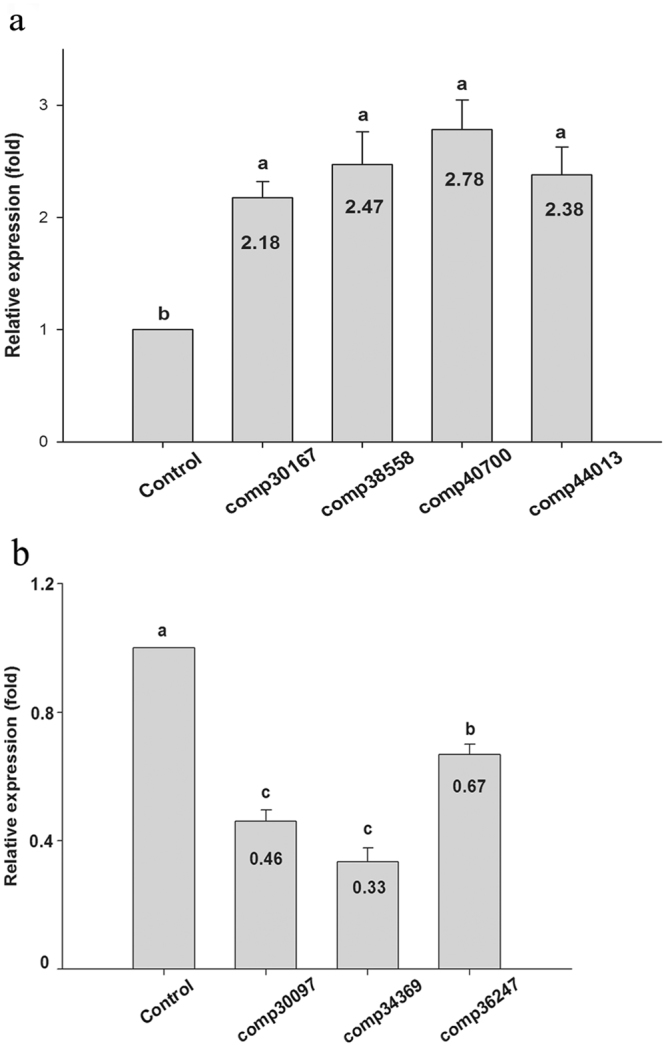
Figure 3.

Relative expression levels of seven P450 unigenes in imidacloprid-treated B. odoriphaga. (a) Four upregulated P450s unigenes; (b) Three downregulated P450 unigenes. The transcription levels of the seven P450s unigenes were determined by quantitative real time PCR. Each bar indicates the mean of three biological replicates (±SE). 18 s was used as a reference gene. The different letters on the bars represent significant differences between treatment and control group based on Duncan’s multiple comparison test (P < 0.05). Numbers in each bar represent fold change compared with the control.
