Fig. 1.
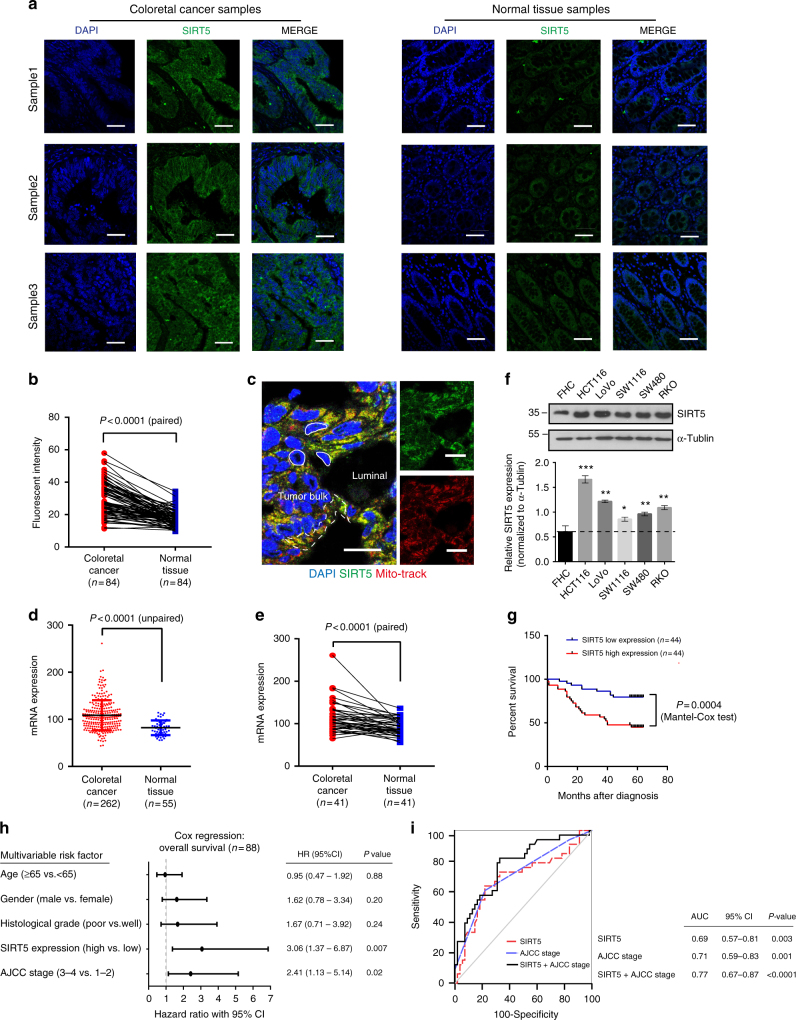
SIRT5 expression correlates with poor outcome in patients with colorectal cancer. a Immunofluorescent staining for SIRT5 (green) in CRC tissues (left) and the corresponding normal tissues (right). Scale bars indicate 50 µm. b Plot representing the statistical analysis of SIRT5 protein levels in 84 CRC samples and their paired normal tissues (P < 0.0001, Student’s t-test). c CRC tissues were immunostained for SIRT5 (green) and Mito-track (red); yellow in the merged magnified images (left) indicates that SIRT5 was highly abundant in the mitochondria of the CRC cells. The white solid line delineates the cell nucleus. The white dashed line delineates the cancer cell cytoplasm. Scale bars indicate 25 µm. d, e mRNA expression of SIRT5 is upregulated in human CRC (GEO data set GSE 68468) (d). Results are mean ± SD. SIRT5 expression in the same data set but compared with paired-adjacent normal tissue using Student’s t-test (e). f SIRT5 protein levels were identified in CRC cell lines relative to the normal human colon cell line FHC by western blotting (upper). Quantification of SIRT5 protein levels normalized to α-tublin (lower). *P < 0.05, **P < 0.01, ***P < 0.001. Results are mean ± SD based on two independent experiments. g Kaplan–Meier survival analysis of patients with CRC separated into two groups by the median for the SIRT5 signal. The higher signal is shown in red (n = 44), and the lower signal is shown in blue (n = 44). P values were calculated by a log-rank (Mantel–Cox) test. h Multivariate survival analysis was performed using Cox’s regression model. The hazard ratio (HR) and 95% confident interval (CI) are plotted for each factor. i ROC curve analysis showing the ability of AJCC stage (blue dashed line), SIRT5 level (red dashed line), or the combination of two factors (black line) to predict survival in CRC cases. The area under curve (AUC) with 95% CI and the P values are shown in the table on the right

