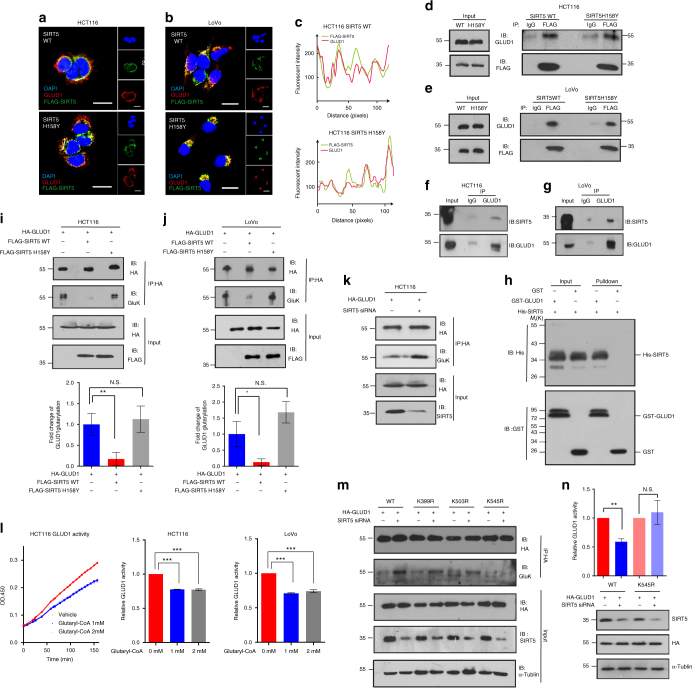
Fig. 6.
The direct interaction between GLUD1 and SIRT5 causes hypoglutarylation of GLUD1. a, b HCT116 (a) and LoVo (b) cells were immunostained for FLAG-SIRT5 WT/H158Y (in green) and GLUD1 (in red); yellow in the merged magnified images (left) indicates the co-localization. Scale bars indicate 20 μm. c Fluorescence intensity of FLAG-SIRT5 WT/H158Y (green line) and GLUD1 (red line) traced along the white line in HCT116 using the line profiling function of the ImageJ software. d, e FLAG-SIRT5 WT/H158Y were immunoprecipitated with anti-FLAG antibody and followed by western blotting with an anti-GLUD1 antibody in HCT116 (d) and LoVo (e) cells. f, g The interaction between endogenous GLUD1 and SIRT5 in HCT116 (f) and LoVo (g) cells. h GST pull-down assays revealed the interaction between SIRT5 and GLUD1. In vitro-translated SIRT5 was incubated GST fusion of GLUD1 or GST, and analyzed by western blotting. The bound SIRT5 is indicated by an arrow on the right. i, j Exogenous GLUD1 proteins were purified in HCT116 (i) and LoVo (j) cells expressing the control vector, SIRT5 WT, and SIRT5 H158Y; and the glutarylation (GluK) levels of GLUD1 were determined by western blotting. Integrated density values were calculated using the ImageJ software. k Exogenous GLUD1 was purified upon SIRT5 knockdown, and the GluK level of GLUD1 was determined. l HA-tagged GLUD1 proteins were purified and incubated with different concentrations of glutaryl-CoA (0, 1, and 2 mM) at 37 °C for 60 min. The GLUD1 activity was determined. Left, representative images (n = 6). Right, quantification of GLUD1 activity. m Wild-type GLUD1, K399R, K503R, and K545R mutants were transfected into HCT116 cells followed by SIRT5 knockdown. The GLUD1 was immunoprecipitated and the level of GluK was determined. n HCT116 cells expressing HA-tagged GLUD1 WT/K545R mutant were treated with or without SIRT5 siRNAs. The GLUD1 activity was measured and normalized against the protein levels. The results in i–n are the mean ± SD of three independent experiments. P values were calculated by ANOVA with Tukey’s test. *P < 0.05, **P < 0.01, ***P < 0.001, N.S. = not significant for the indicated comparison

