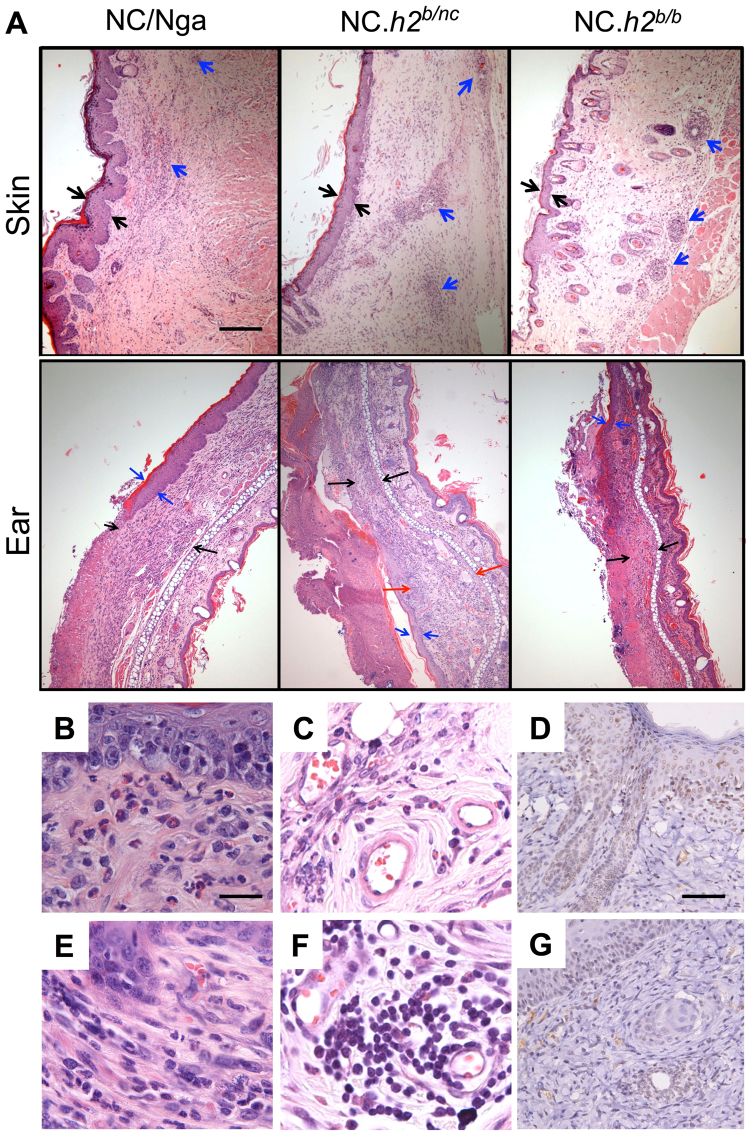
Figure 3.
Histologically on DNFB-induced dermatitis, contact dermatitis was induced in NC.h2b/nc and NC.h2b/b while AD-like lesions were induced in NC/Nga. (A) Thickening of the epidermis (black arrow) and the perivasculitis of the dermis (blue arrow) in upper panel (skin) are indicated. Thickening of the epidermis (blue arrow) and dermis (black arrow) in lower panel (ear) are indicated. Partially extended thickening of the dermis is highlighted (red arrow). Scale bar corresponds to 100 µm in all images of (A). Against the infiltration of eosinophils in the dermis (B) and in perivascular (C), and the TSLP expression in epidermis (D) in NC/Nga, the infiltration of lymphocytes and plasma cells in the dermis (E) and in perivascular (F), and the TSLP expression in perivascular (G) in NC.h2b/b is indicated. Scale bar in (B), (C), (E), (F) represents 25 µm. Scale bar in (D) and (G) is 50 µm.

