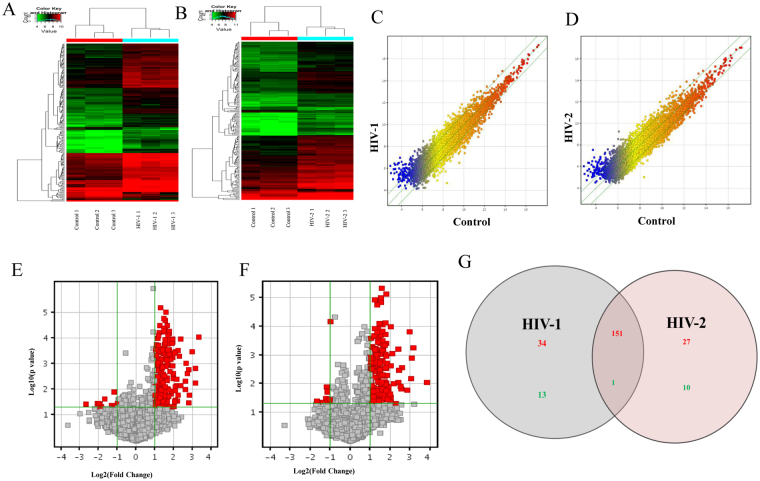
Figure 1.
Differential regulation of lincRNAs in HIV-1 infected MDMs, HIV-2 infected MDMs and uninfected MDMs. (A) The hierarchical clustering of differentially regulated lincRNAs for HIV-1 and uninfected controls. (B) The hierarchical clustering of differentially expressed lincRNAs for HIV-2 and uninfected controls. In the cluster heat map, red indicates high relative expression, and green indicates low relative expression. (C,D) Scatter plot of lincRNAs HIV-1 (C) or HIV-2 (D) infected cells. The values on the X and Y axes of the scatter plot are the normalized signal values of the compared groups (log2 scaled). The green lines are Fold Change Lines (The default fold change value is 2.0). The expression of the genes above the top green line or below the bottom green line indicate greater than 2.0 fold change between the infected and uninfected control groups. (E,F) Volcano plots of lincRNA, expression fold change for HIV-1 (E) and HIV-2 (F) infections in MDMs in comparison to uninfected control: The plot shows differentially regulated lincRNAs with statistical significance that passed Volcano Plot filtering (Fold Change ≥ 2.0 and p-value ≤ 0.05). The vertical green lines correspond to 2.0-fold up and down and the horizontal green line represents a p-value up to 0.05. The red point in the plot represents differentially regulated genes with statistical significance. (G) Venn diagrams indicates the numbers of overlapping and non-overlapping differentially regulated lincRNAs in HIV-1 infected MDMs infected and HIV-2 infected MDMs compared to uninfected MDMs Red color indicates upregulation and green color indicates down regulation of lincRNA expression respectively.

