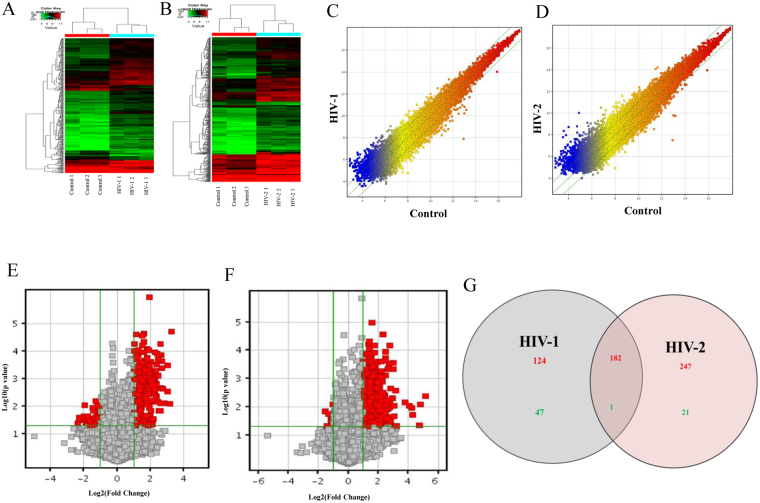
Figure 2.
Analysis of differentially regulated mRNAs in MDMs infected with HIV-1, HIV-2 and uninfected controls. (A) The hierarchical clustering of differentially regulated mRNAs for HIV-1 and uninfected controls. (B) The hierarchical clustering of differentially regulated mRNAs for HIV-2 and uninfected controls. (C and D) Scatter plot of mRNAs regulated in HIV-1 (E) or HIV-2 (F) infected cells. (E,F) Volcano plots of the mRNAs, expression fold change for HIV-1 (E) and HIV-2 (F). The red point in the plot represents the differentially regulated genes with statistical significance. (G) Venn diagrams indicates the numbers of overlapping and non-overlapping differentially regulated mRNAs in HIV-1 infected MDMs infected and HIV-2 infected MDMs compared to uninfected MDMs Red color indicates upregulation and green color indicates down regulation of mRNA expression respectively.

