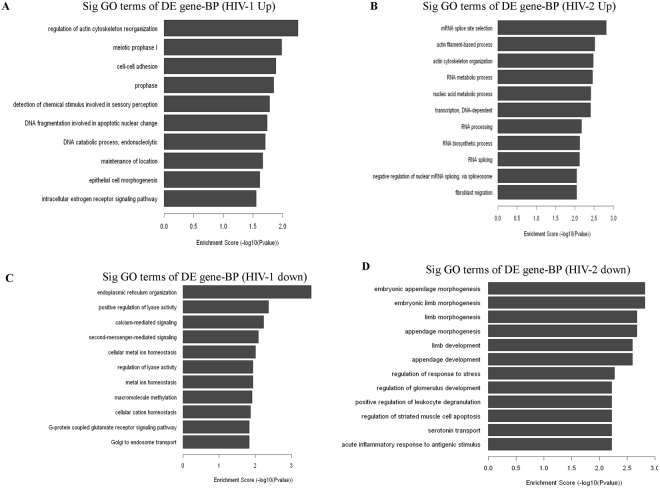
Figure 3.
Gene Ontology (biological process) analysis of differentially regulated genes. (A,C) The bar plot shows Fold Enrichment value of the significant enrichment terms and pathway analysis for differentially expressed up regulated and down regulated genes in HIV-1 infected MDMs respectively. (B,D) The bar plot shows Fold Enrichment value of the significant enrichment terms and pathway analysis for differentially expressed up regulated and down regulated genes in HIV-2 infected MDMs respectively.

