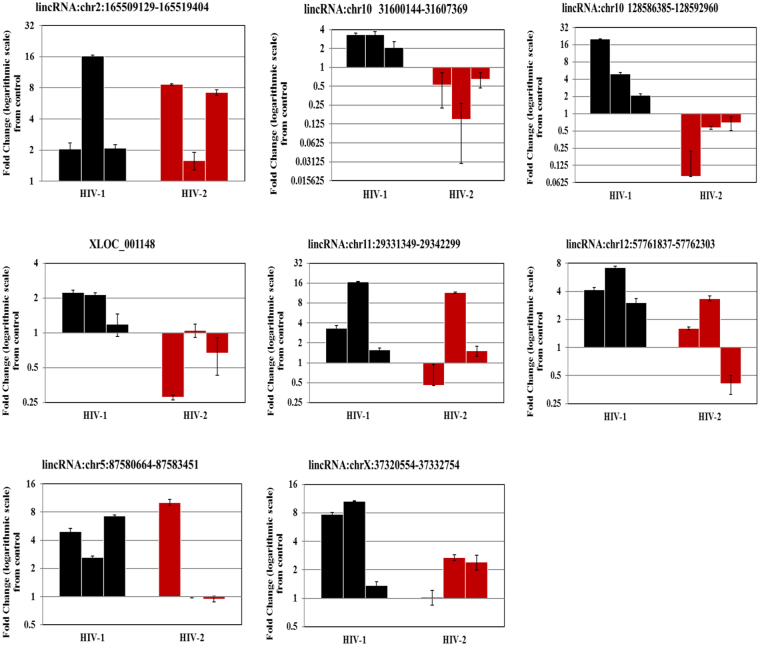
Figure 4.
qPCR validation of host lincRNAs in MDMs infected with HIV1 and HIV-2 Day-7 post infection. The data represents results from 3 independent experiments. Values are fold-change plotted on a Log scale for HIV-1 (black) and HIV-2 (red) infected MDMs relative to an uninfected control MDMs. qPCR was normalized with the endogenous GAPDH control and measured the relative amount of target gene. Expression of fold change is calculated as n-fold difference in expression of gene-of-interest relative to GAPDH gene for infected and uninfected cells as n-fold = 2^ − (ΔCt infected −ΔCt uninfected). Each sample was run in triplicate to ensure accurate fold change estimation and the results expressed as mean ± SEM.

