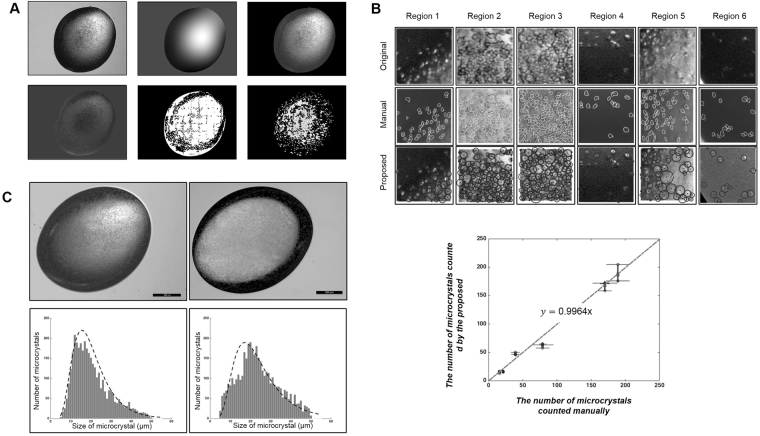
Figure 3.
Images of protein microcrystallization drops. (A) Microcrystallization images processed by the proposed segmentation method: original drop image obtained by an ordinary light microscope, image bias map, and image after removal of the background (upper panel, left to right). The image after removal of the image bias and filling of the image background with the average of the edges of the bias corrected image, image after application of the localized fuzzy c-mean clustering algorithm, and segmented images were used to analyze the number of microcrystals (lower panel, left to right). The original image size was 2592 1944 pixels, and the localized fuzzy c-mean algorithm was applied to a small region of 200 200 pixels. (B) Comparison of manual and proposed microcrystal counting methods for selected regions of an image (upper panel): selected regions 1–6 of the original image (top row), manually marked microcrystals in each region (middle row), and microcrystals in each region marked by the proposed method (bottom row). The number of microcrystals counted manually was plotted against that of microcrystals counted by the proposed method (lower panel). The microcrystals were counted by three experts four times and by the proposed method three times. The data represent the means ± SD. (C) Original high-resolution (left) and ordinary light (right) microscopy images (upper panel) and the histogram analysis results of the high-resolution (left) and ordinary light (right) microscopy images (lower panel).

