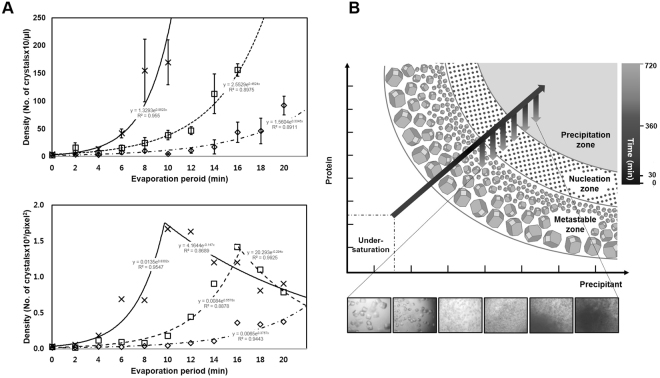
Figure 4.
Supersaturation-controlled microcrystallization as a function of evaporation period for microcrystallization of lysozyme. (A) Plots of microcrystal density as a function of evaporation period for microcrystallization of lysozyme. The microcrystal densities were analyzed manually (upper panel) and by the proposed algorithm (lower panel). The lines are for a 1.8 μL drop with time periods from 0 to 22 min. Lysozyme protein concentrations of 55, 65 and 75 mg/mL were used, as shown by dashed dotted, dashed and continuous lines, respectively. The microcrystal densities at each time were calculated manually four times (upper panel) and by the proposed method three times (lower panel). The data represent the means ± SD. (B) Schematic representation of a two-dimensional phase diagram, illustrating estimated paths of microcrystallization, indicated by arrows, mediated by the supersaturation-controlled microcrystallization method. Long diagonal and short vertical arrows represent the changes in concentration for each time delay, resulting in the formation of single crystals, micro- or nanocrystals, and precipitates. The gray-scale in the arrows represents a real-time estimate from 0 to 720 min. The paths lead through different levels of supersaturation to rapidly reach the border between the metastable, nucleation, and precipitation zones.

