
Figure 6.
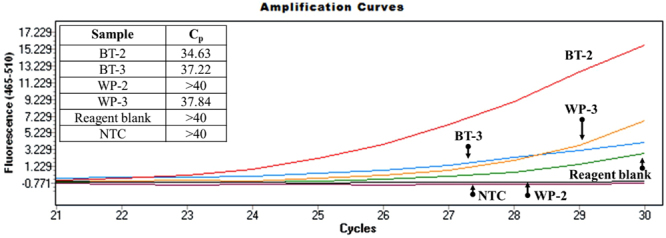
A qPCR amplification curve comparing the responses of DNA amplified from black tar (BT-2 and BT-3) and white powder heroin (WP-2 and WP-3) using primer N263. Note the table in the upper left containing the cycle threshold values (Cp).
Official websites use .gov
A
.gov website belongs to an official
government organization in the United States.
Secure .gov websites use HTTPS
A lock (
) or https:// means you've safely
connected to the .gov website. Share sensitive
information only on official, secure websites.
A qPCR amplification curve comparing the responses of DNA amplified from black tar (BT-2 and BT-3) and white powder heroin (WP-2 and WP-3) using primer N263. Note the table in the upper left containing the cycle threshold values (Cp).