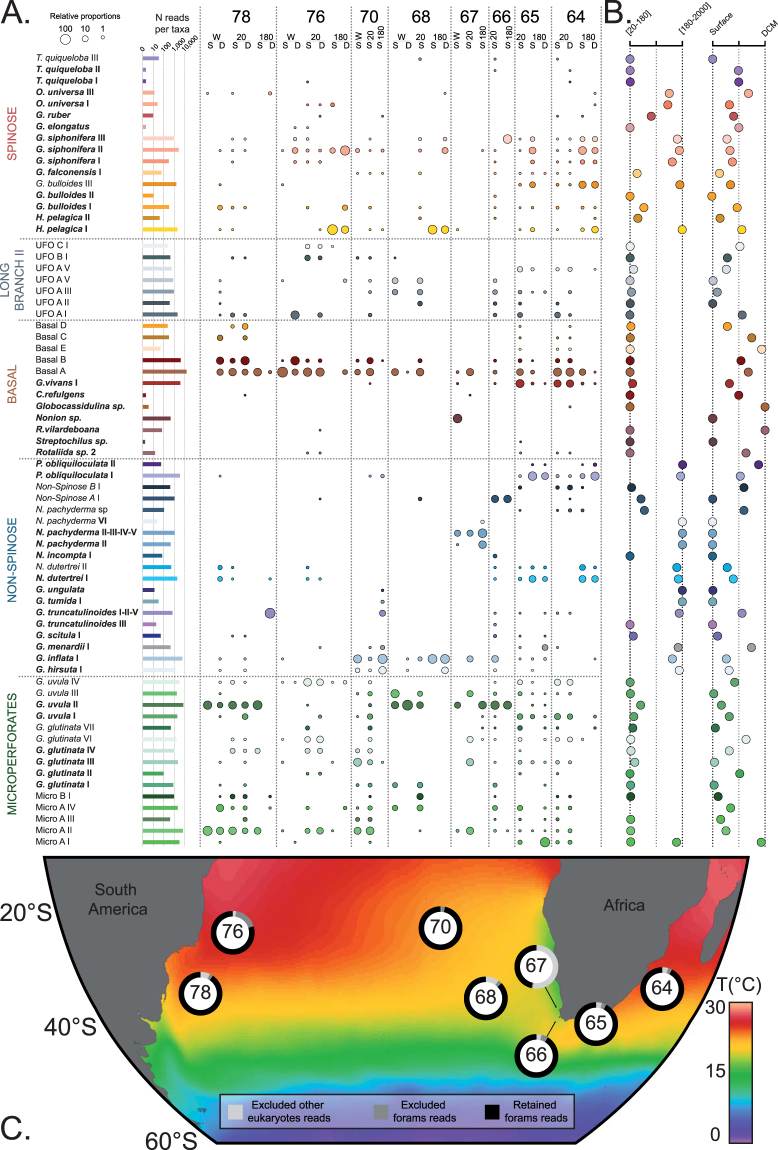
Figure 2.
Ecological dataset. (A) Abundance and occurrence of the 69 planktonic foraminiferal taxa detected in our environmental survey. The lines represent the occurrence of each taxon in all explored Tara Oceans stations, and the columns represent the individual samples. The size of the circles is proportional the relative abundance of each taxon within each sample (log values). 180, 20 and W correspond to the [180–2000 µm], [20–180 µm] and [>0.8 µm] size fractions. D and S correspond to the Deep Chlorophyll Maximum and Surface depths, respectively. (B) Relative occurrences of each taxon between the size fractions [20–180 µm] and [180–2000 µm] and between surface and DCM. (C) Geographic location of the station collections. The ring around the station number shows the partition of the reads obtained at each station. The background shows the mean annual Sea Surface Temperature extracted from the World Ocean Atlas 201365 and was generated with Ocean Data View66.

