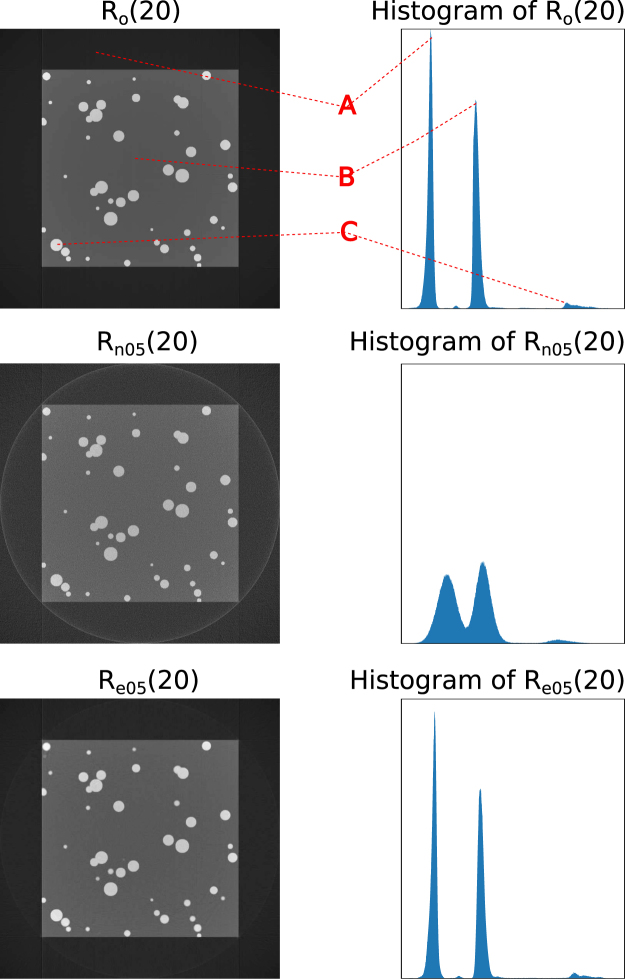
Figure 2.
Reconstructed slice (left) and corresponding histograms (right). The top row is a slice of the ground truth reconstruction (Ro); the middle row is the same reconstructed slice (Rn05) from the projections with 5% noise (Pn05); the bottom row is the same reconstructed slice (Re05) from the CNN enhanced projections (Pe05). ‘A’, ‘B’ and ‘C’, correspond to the black region outside the object, the gray region inside the object and the white particles.

