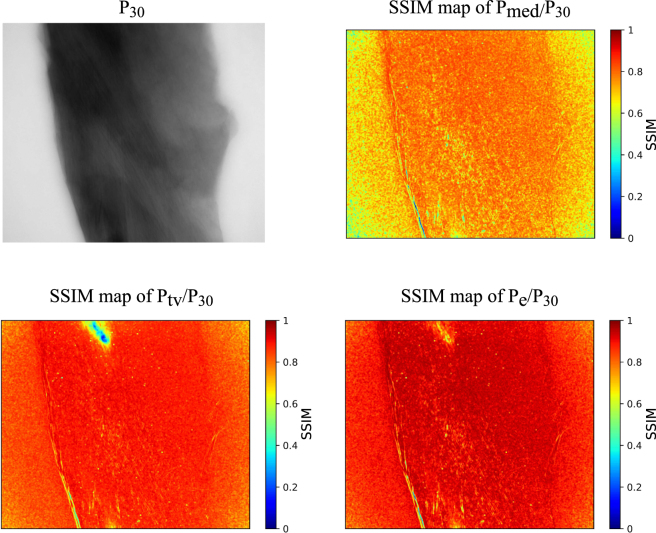
Figure 6.
Comparing the CNN projection enhancement algorithm with the traditional denoising algorithms. The top left image is the projection with 30 s exposure time at 0°. The top right is the SSIM map between the 2 s projection denoised with median filter and the 30 s projection Pmed(0)/P30(0). The bottom left is the SSIM map between the 2 s projection denoised with tv filter and the 30 s projection Ptv(0)/P30(0). The bottom right is the SSIM map between the CNN enhanced projection and the 30 s projection Pe(0)/P30(0).

