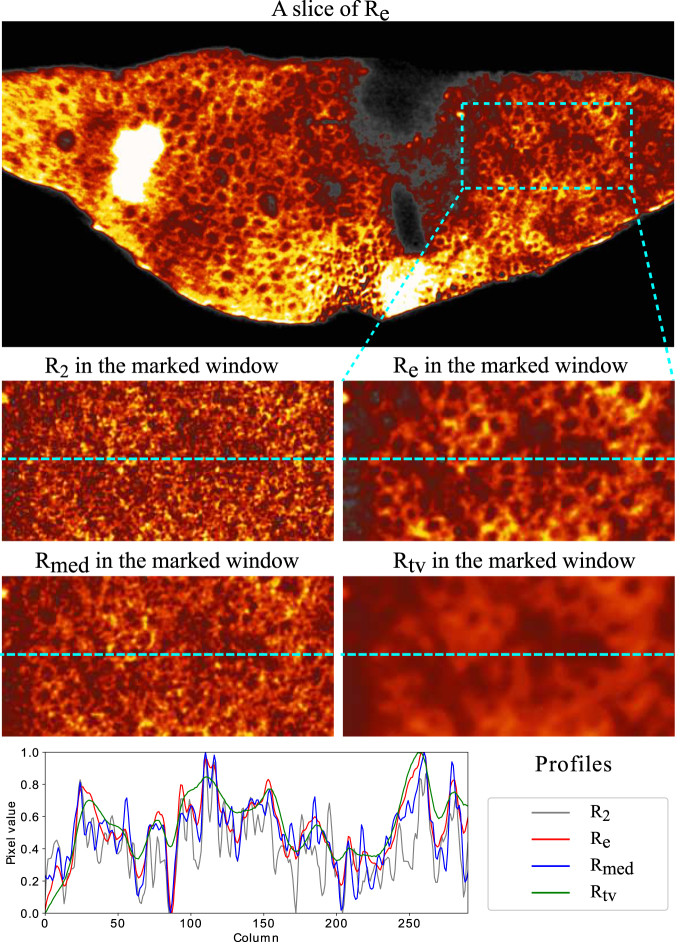
Figure 7.
An example of the reconstructions from different quality of the projections of the mouse brain sample. The top row is a slice that reconstructed from the CNN enhanced projections. The four small images in the middle rows are different reconstructions for the section of the blue-dash rectangular window above. They are the reconstructions from the projections with 2 s exposure, the projections enhanced with CNN, the projections denoised with median filter and TV respectively. The plots in the bottom row are the profiles taken from the dash lines of the four small images.

