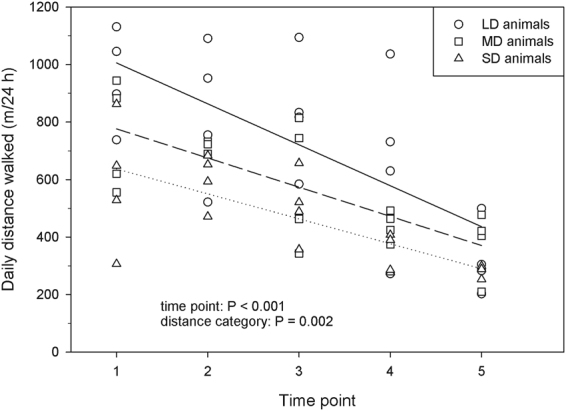
Figure 2.

Development of the daily distance walked by the pigs for the three distance categories over five different time points (lsmeans, n = 12 focus animals; LD = long distance, MD = medium distance, SD = short distance). Lines indicate the calculated regression lines of each distance category over the different time points (solid line = LD animals: y = 1148.0x − 142.4, r² = 0.475; dashed line = MD animals: y = 878.0x − 101.5, r² = 0.560; dotted line = SD animals: y = 723.6x − 86.8, r² = 0.517).
