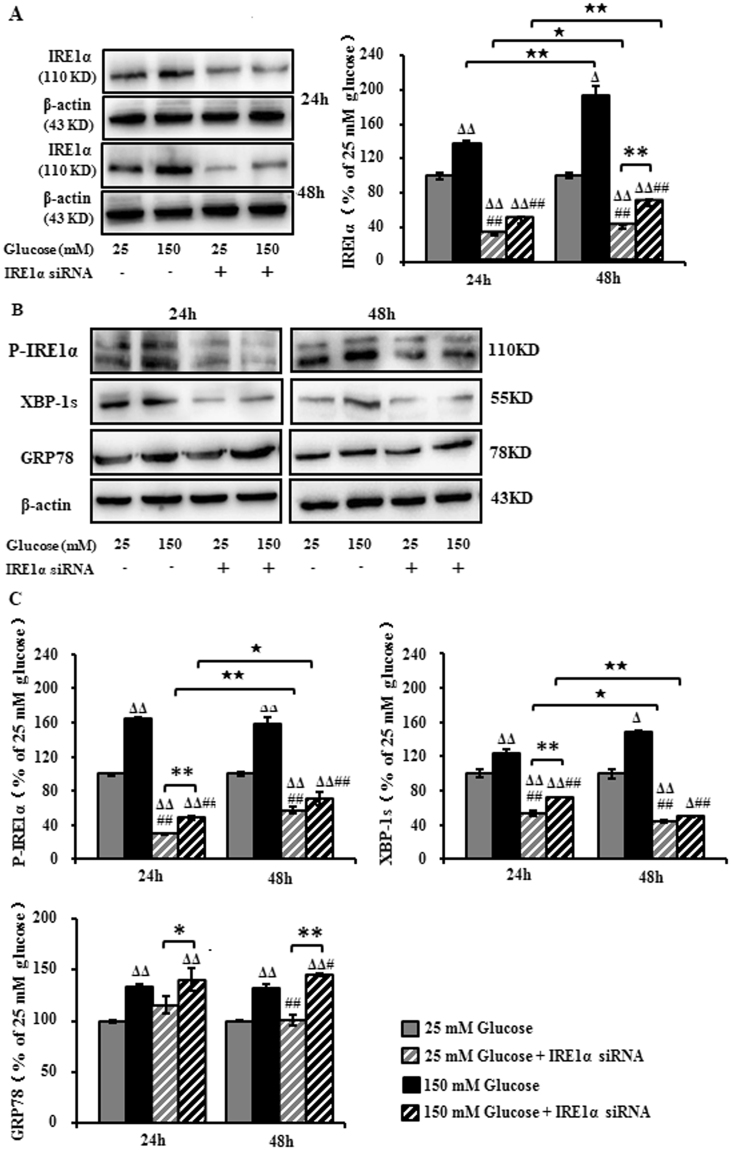
Figure 4.
Expression of IRE1α, XBP-1s and GRP78 in RSC96 cells transfected with IRE1α siRNA and exposed to high glucose. (A–C) Representative Western blots using RSC96 cells and probed with antibodies against IRE1α, P- IRE1α, XBP-1s and GRP78. Results are expressed as mean ± SEM of the percentage of the respective 25 mM glucose group and analyzed using one-way ANOVA analysis. ΔP < 0.05, ΔΔP < 0.01, compared to 25 mM glucose; #P < 0.05, ##P < 0.01, compared to 150 mM glucose; ★P < 0.05, ★★P < 0.01, Student’s unpaired t-test compared to 24 hours’ time point. *P < 0.05, **P < 0.01 (n = 4 per group).

