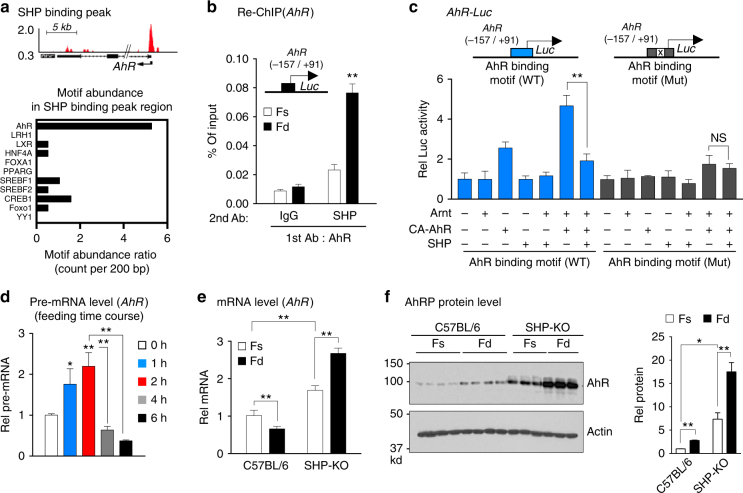
Fig. 5.
AhR induces its own expression and SHP inhibits the AhR function. a SHP binding peak at the AhR promoter from published ChIP data and potential binding sites for transcription factors (bottom) within SHP peak region (top) were identified using the JASPAR database. b Mice (n = 5 mice per group) were refed for 6 h after fasting overnight. Liver chromatin was immunoprecipitated with AhR antibody first and then eluted and re-precipitated with SHP antibody. c Hepa1c1c7 cells were transfected with indicated plasmids. After 2 days, cells were treated with FGF19 for 1 h, and luciferase activities were measured and normalized to β-galactosidase activity (n = 5). d Mice (n = 5 mice per group) were fasted overnight or fasted and refed for the indicated times, and AhR pre-mRNA levels were determined by qRT-PCR. e, f C57BL/6 control mice and SHP-KO mice (n = 3–5 mice per group) were fasted overnight (Fs) or fasted and refed for 6 h (Fd). Hepatic mRNA (e) and proteins (f) levels were determined. Full size immunoblots are in Supplementary Figure 12b. Means ± SD are shown, and statistical significance was measured using the c, d one- or b, e, f (right) two-way ANOVA with the FDR post-test. *P < 0.05, **P < 0.01, NS, statistically not significant

