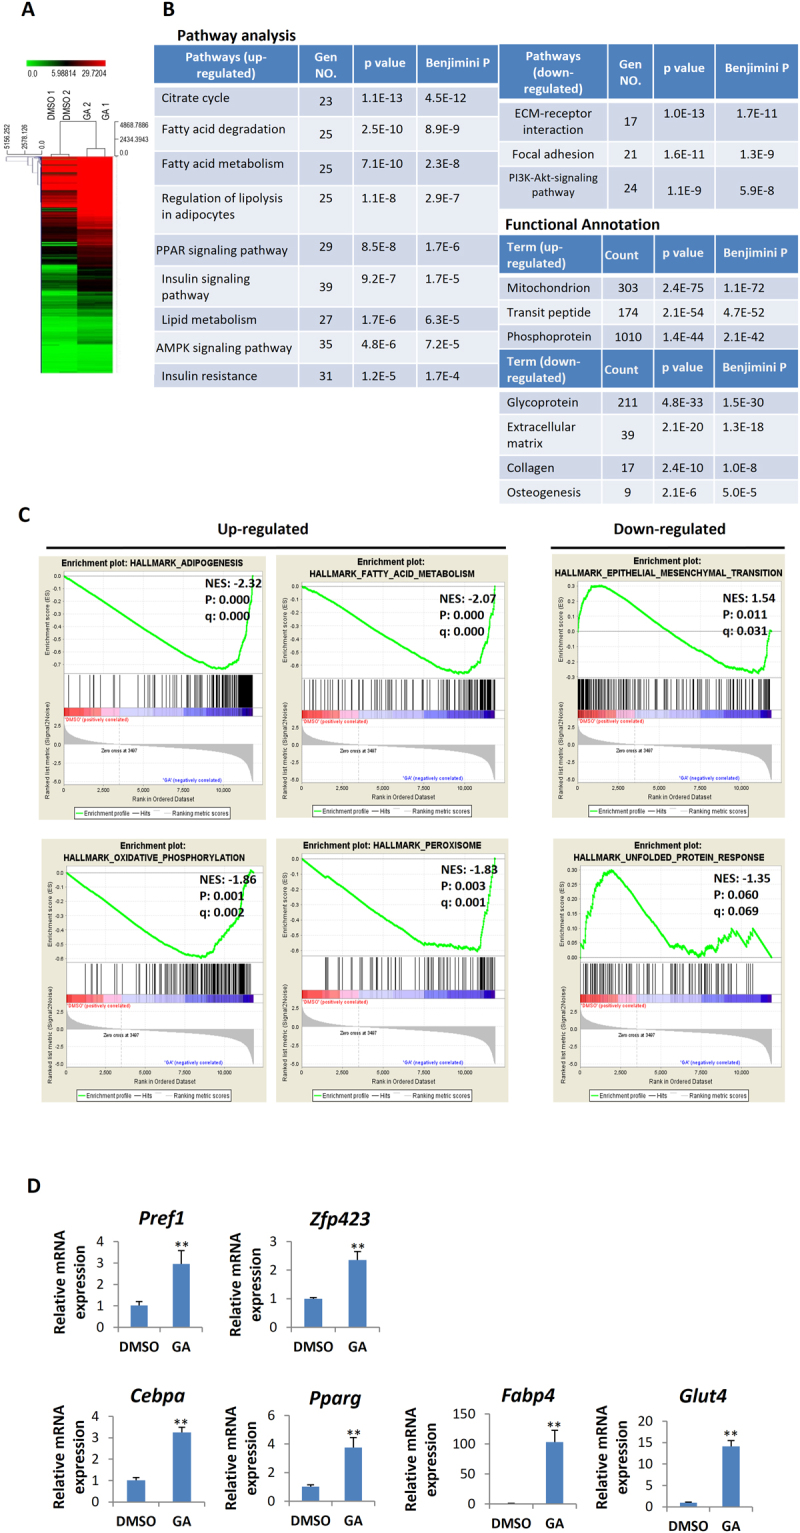
Figure 4.

Transcriptomic changes in the mBMSCs caused by DEX-plus-GA treatment. (A) Heat map of differential gene expression in mBMSCs treated with GA (50 μM) plus DEX vs. DMSO plus DEX for 3 d (n = 2). (B) The most up-regulated and down-regulated pathways in the GA-plus-DEX treatment group revealed by DAVID GO analyses. Genes that showed significant difference between GA and DMSO treatments (p < 0.05) and had a log2 fold change > 0.5 or < –0.5 were chosen for analysis. (C) GSEA analyses of up-regulated and down-regulated gene sets (NES: normalized enrichment score; p: nominal p-value; q: false discovery rate q-value). (D) Altered expression of adipogenic genes in the mBMSCs treated with GA (50 μM) plus DEX vs. DMSO plus DEX for 4 d (**p < 0.01; n = 4).
