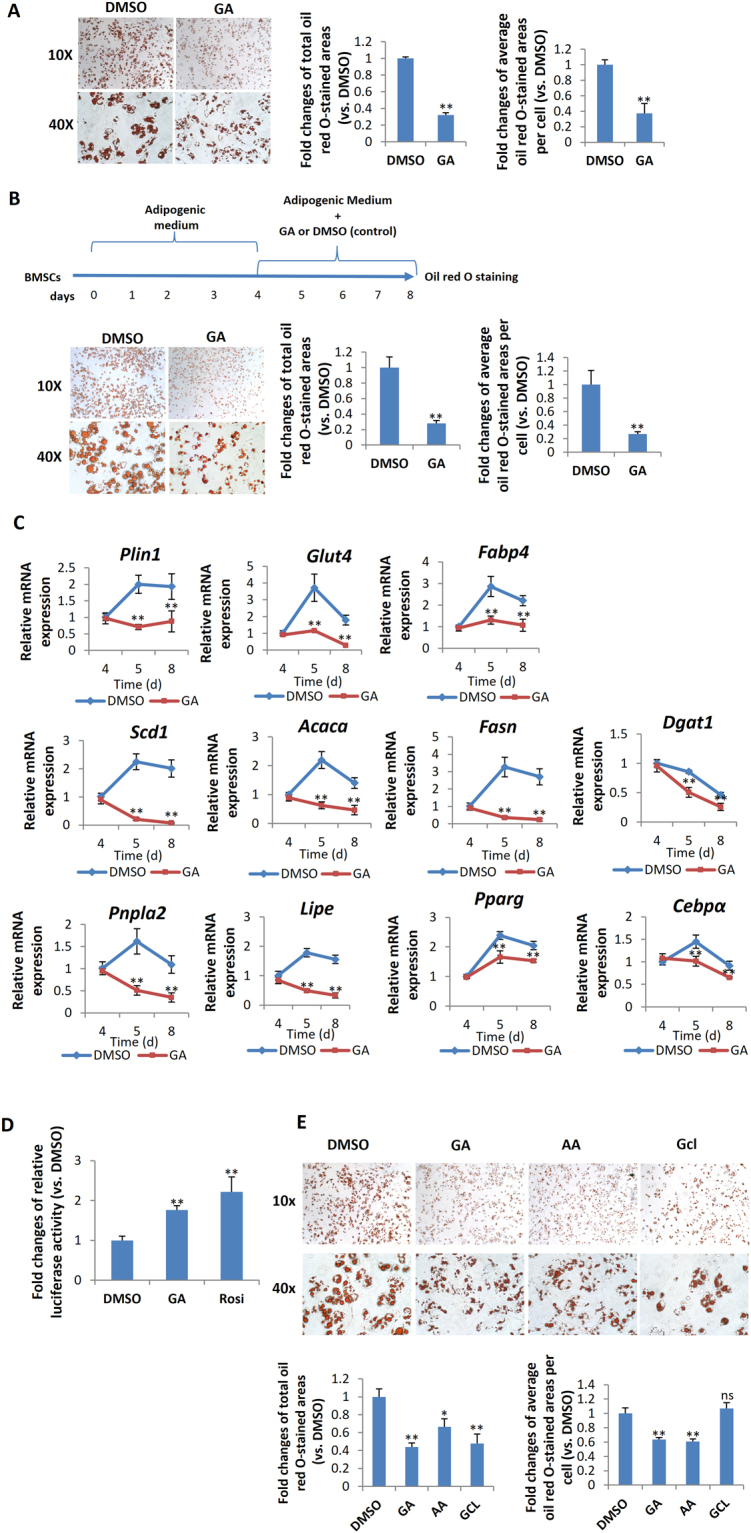
Figure 6.

GA inhibited adipocyte maturation of mBMSC. (A) mBMSC adipogenic culture treated with GA (50 μM) over the entire differentiation period (7 d). The total oil red O-stained areas and the average oil red O-stained area per cell are quantified on the right (**p < 0.01; n = 4). (B) mBMSC adipogenic cultures treated with GA (50 μM) at a later stage (see time line at the top of panel). The cells had dramatically reduced lipid accumulation. The oil red O–stained areas and average stained area per cell are quantified on the right (**p < 0.01; n = 3). (C) GA (50 μM) treatments decreased the markers for lipogenesis, lipolysis, mature adipocytes, and master regulators of adipogenesis (**p < 0.01; n = 4). (D) PPRE Luciferase reporter assay show increased PPAR activity in GA (50 µM) treated HEK293 cells. Firefly-luminescence intensity was normalized to the Renilla luminescence. Rosiglitason (1 μM) were used as a positive control (**p < 0.01; n = 4). (E) As indicated by oil red O staining, mBMSCs cultured in adipogenic medium with GA (50 µM) or AA (50 µM) over the entire differential period (7 d) showed a decrease in lipid accumulation. Gcl (7 µM) treated cells showed decreased total lipid content while the average lipid content in each adipocyte was unchanged. The oil red O–stained areas and average stained area per cell are quantified below (*p < 0.05, **p < 0.01; n = 3).
