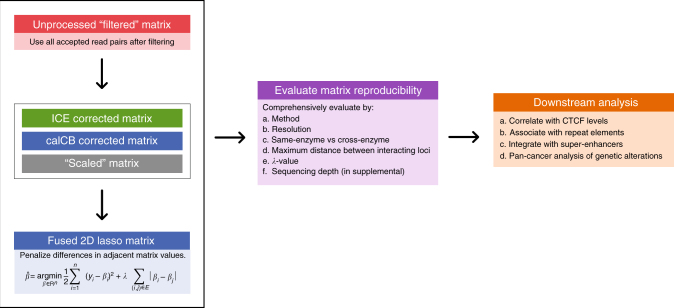
Fig. 1.
Overall workflow and benchmarking strategy. Our analysis starts with unprocessed Hi-C contact matrices. We then generate processed Hi-C matrices using ICE “correction”, our “scaling” approach and calCB. Fused two-dimensional lasso is applied on the processed Hi-C matrices. Matrix reproducibility between biological replicates is assessed across samples for a variety of parameters using stratum-adjusted correlation coefficients21. Finally, downstream analysis, involves the characterization of TAD boundaries based on their insulating strength, the enrichment in CTCF binding, proximity to repeat elements and super-enhancers, and, their genetic alterations in cancer

