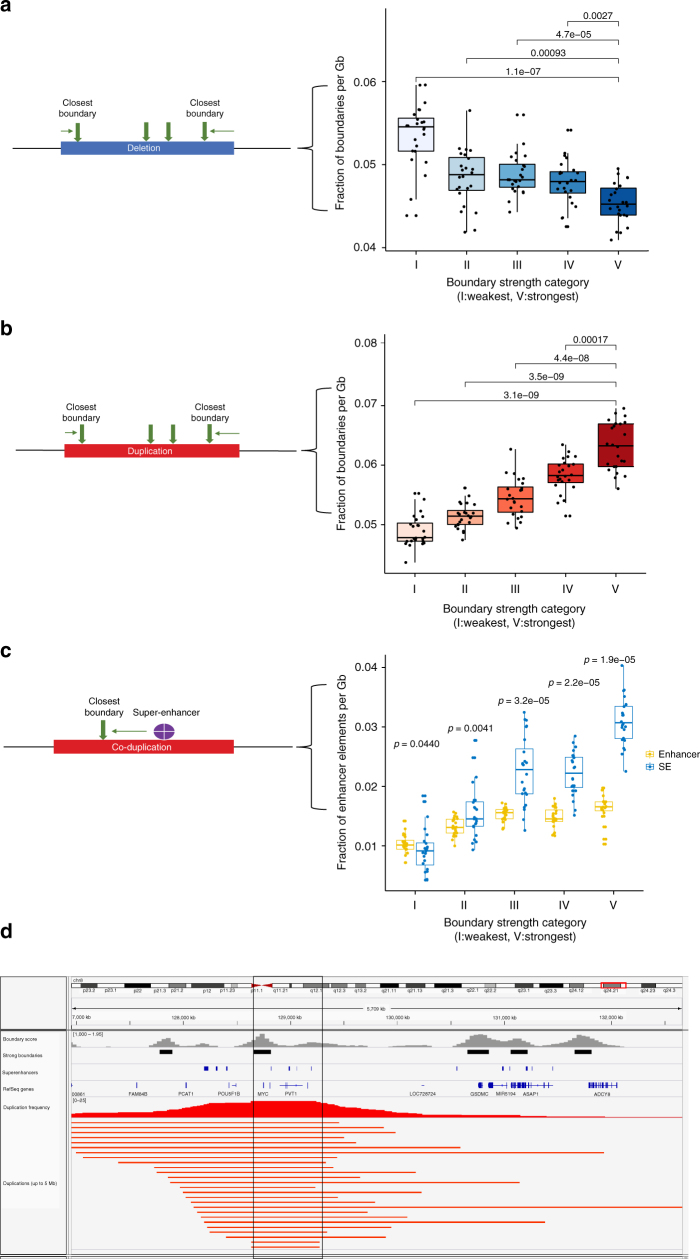
Fig. 5.
Pan-cancer analysis of strong vs. weak TAD boundaries (high sequencing depth = 80 million intrachromosomal read pairs). a Schematic of pan-cancer analysis (left panel) and classification of focally deleted boundaries in cancer according to their strength (right panel). b Schematic of pan-cancer analysis (left panel) and classification of focally duplicated boundaries in cancer according to their strength (right panel). c Schematic of pan-cancer analysis (left panel) and co-duplications of TAD boundaries with regular enhancers and super-enhancers in cancer (right panel). d Snapshot of the MYC locus: a strong boundary (black bar) is frequently co-duplicated with MYC and potential super-enhancers in cancer patients (highlighted area). IGV tracks from top to bottom: average insulation score across cell types (gray), strong boundaries (black bars), super-enhancer track from SEA (blue bars), RefSeq genes, duplication frequency (red graph) and ICGC patient tandem duplications (red bars). All statistical tests are paired two-sided Wilcoxon rank-sum tests between distributions defined across samples (each sample is a dot in the boxplots). The box in each boxplot represents the first (Q1) and third (Q3) quartiles and the ends of the whiskers are positioned 1.5*(Q3-Q1) away from the ends of the box.

