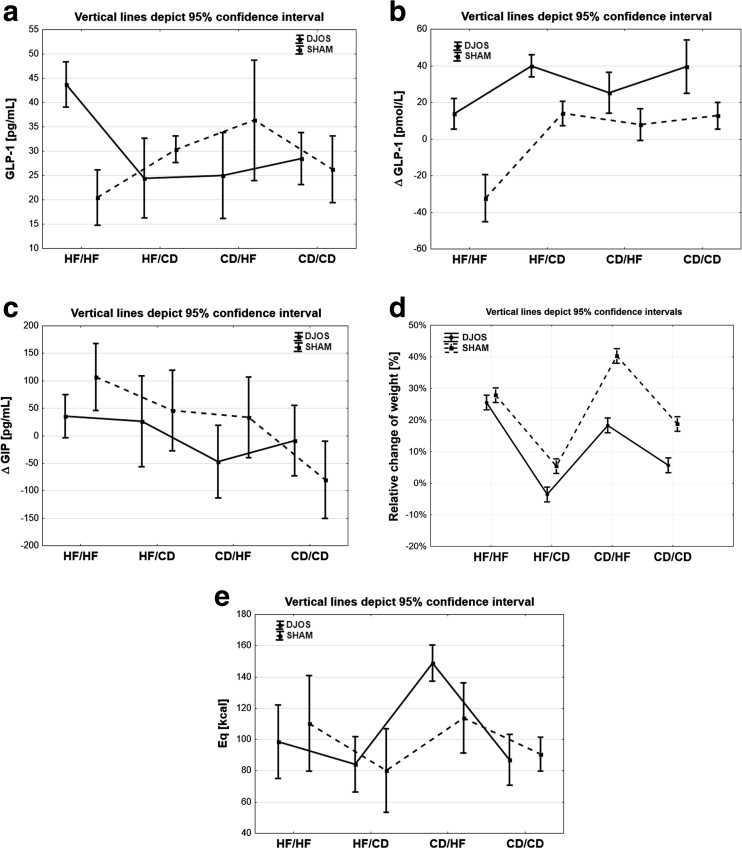
Fig. 3.
a Mean values of glucagon-like peptide 1 in four groups of diet, according to the operation type. 95% CI as calculated from Student’s t test. b Mean values of delta glucagon-like peptide 1 in four groups of diet, according to the operation type. 95% CI as calculated from Student’s t test. c Mean values of delta gastric inhibitory polypeptide in four groups of diet, according to the operation type. 95% CI as calculated from Student’s t test. d Weight profiles in four groups of diet, according to the operation type. 95% CI as calculated from Student’s t test. e Mean values of Eq in four groups of diet, according to the operation type. 95% CI as calculated from Student’s t test

