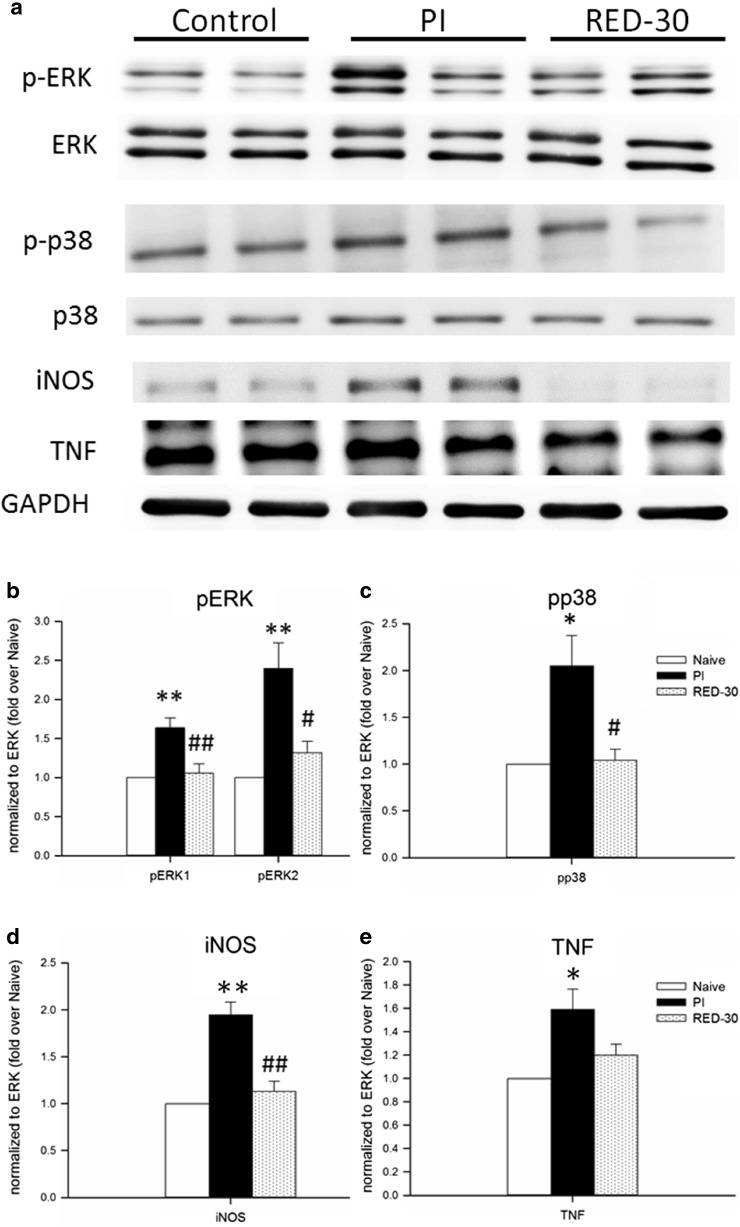
Fig. 4.
LLLA suppressed PI-induced molecular activation. a Representative western blot diagram of protein expression among the groups on post-PI day 3. b Relative p-ERK1 and p-ERK2 levels. c, d, e Relative p-p38, iNOS, and TNF levels among the groups, respectively. *p < 0.05, **p < 0.01 for RED-30 group vs. PI group; #p < 0.05, ##p < 0.01 for RED-15 group vs. PI group, +p < 0.05, ++p < 0.01 for RED-15 group vs. RED-30 group through one-way ANOVA with Tukey’s post hoc test. N = 4–5 for each group

