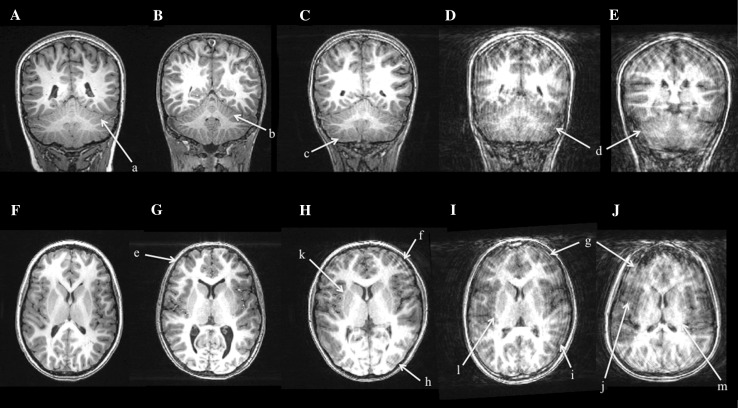
Fig. 6.
Examples of different quality of structural neuroimaging data using the Systematic Quality Assessment Rating Scale for Structural MRI: a crystal clear foliation in the cerebellum, b good differentiation in the grey matter/white matter contrast in the cerebellar folia, c some blurring of the grey matter/white matter contrast in the cerebellar folia, d poor or no differentiation of the grey matter/white matter contrast in the cerebellar folia, e no axial waves and good grey matter/white matter contrast, f significant waves anterior, g large waves or ringing, h minor waves posterior, i significant blurring of grey matter/white matter contrast, j loss of grey matter/white matter contrast, (k) good differentiation of caudate and putamen, (l) minor blurring of the caudate and putamen (m) loss of grey matter/white matter margins of the caudate and putamen rendering it untraceable

