
Fig. 6.
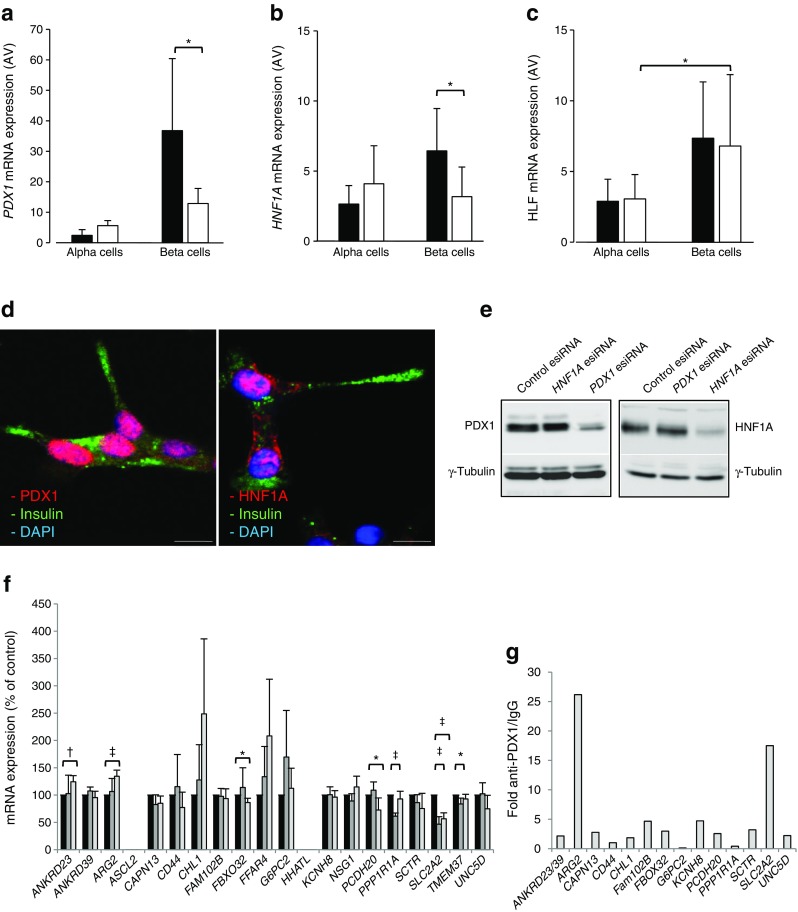
Validation of PDX1, HNF1A and HLF as transcription factors (TFs) located upstream of the T2D islet signature genes. (a–c) RT-qPCR of PDX1 (a), HNF1A (b), and HLF (c) expression levels in alpha and beta cell-enriched fractions from human ND (n = 5, black bars) and T2D (n = 4, white bars) OD islets. *p < 0.05, Student’s t test. (d) Co-immunostaining for insulin (green) and PDX1 or HNF1A (red) in human EndoC-βH1 cells. Nuclei are counterstained with DAPI (blue). (e) Immunoblots for PDX1, HNF1A or γ-tubulin in EndoC-βH1 cells treated with esiRNA for PDX1, HNF1A or with a control esiRNA. Bar, 10 μm. (f) RT-qPCR of the 19 T2D islet signature genes in EndoC-βH1 cells treated with esiRNA for PDX1 or HNF1A or with a control esiRNA (*p < 0.05, † p < 0.01 and ‡ p < 0.001; ANOVA) (n = 4, except for ANKRD39, which was measured three times). (g) Fold enrichment (y-axis) of T2D islet signature genes with predicted binding sites for PDX1 as measured upon chromatin immunoprecipitation with anti-PDX1 antibody vs control IgG followed by RT-qPCR with primers flanking the predicted binding site. The values in (g) are from three independent chromatin immunoprecipitations. esiRNA, endoribonuclease-prepared small interfering RNA; ND, non-diabetic; T2D, type 2 diabetic