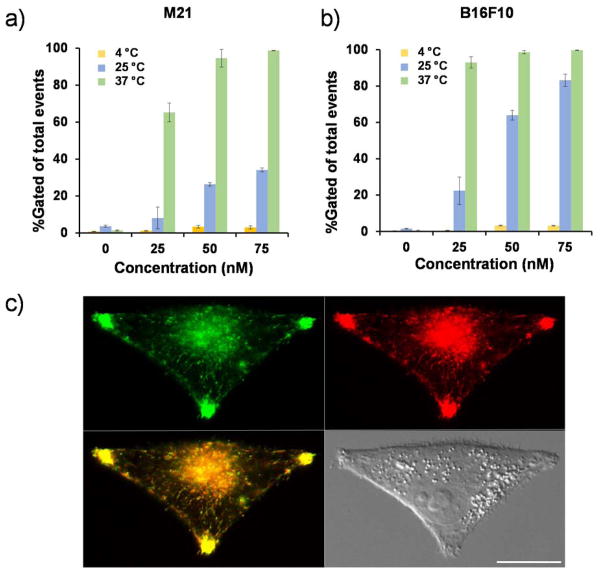
Figure 4. Temperature-dependent uptake of αMSH-PEG-Cy5-C′ dots and cellular internalization.
Specific binding and uptake of αMSH-PEG-C dots in M21(a) and B16F10 (b) cells as a function of temperature using 25nM particle concentrations and flow cytometry. Each data point represents the mean ± s.d. of 3 replicates. (c) αMSH-PEG-C′ dot (1 μM, red) colocalization with a lysosomal marker (LAMP1-GFP) after 4h incubation using M21 cells. Colocalized vesicles (yellow); Scale bar: 10 μm.

