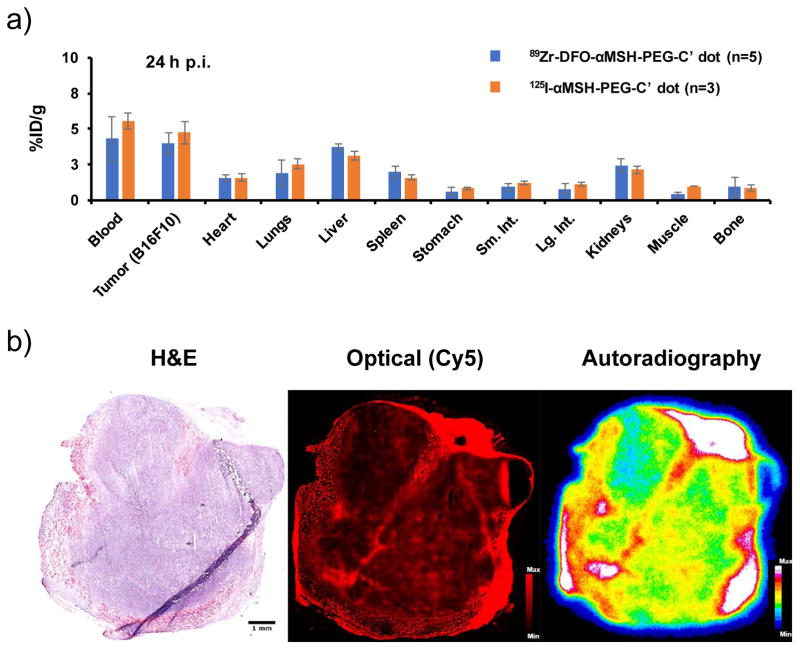
Figure 6. Biodistribution and ex vivo histological studies.
(a) Comparison of the biodistribution profiles in B16F10 tumor-bearing mice 24 h p.i. of 89Zr-DFO-αMSH-PEG-C′ dot (n=5) or 125I-αMSH-PEG-C′ dot (n=3); (b) H&E staining (left, scale bar: 1mm), Cy5-fluorescence microscopy (middle), and autoradiography (right) images of tumor tissue specimen harvested from B16F10 tumor-bearing mouse 24 h p.i. of 89Zr-DFO-αMSH-PEG-Cy5-C′ dots.

