
Fig 1. Overexpression of Tyro3 leads to phosphorylation of ACTN4.
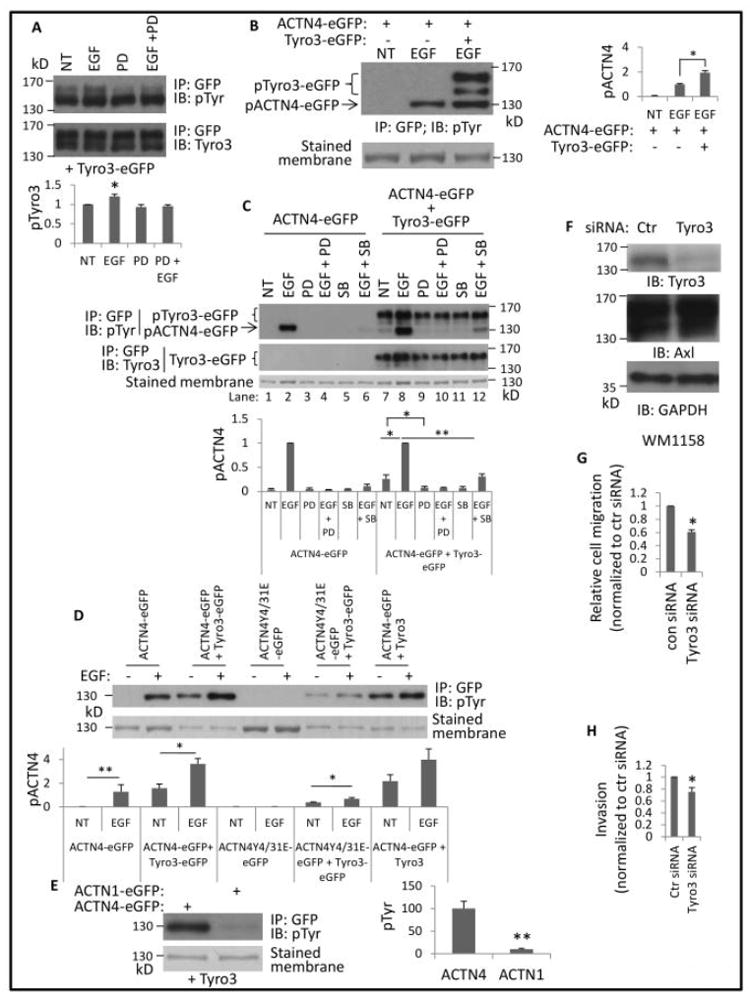
(A) NR6WT cells transfected with Tyro3-eGFP were treated with indicated reagents (10 nM EGF and 5 μM PD 153035 (PD)) for 30 min prior to lysing in RIPA buffer. Protein Tyro3-eGFP was then immunoprecipitated using GFP antibody. Representative images present immunoblotting against pTyr and Tyro3. Phosphorylation level of Tyro3 was quantified and normalized to total immunoprecipitated Tyro3 protein. (B) eGFP-tagged proteins were immunoprecipitated using GFP antibody from cells transfected by appropriate plasmids and treated as indicated reagents. Phosphorylated proteins are marked and the phosphorylation level of ACTN4 was quantified and normalized to total ACTN4 protein. (C) Cells were transfected with appropriate plasmids and treated with indicated reagents for 30 min prior to lysing and immunoprecipitating. PD and SB stand for PD153035 (2.5 μM) and SB203580 (10 μM), respectively. Graph is the relative phosphorylation level of ACTN4 at tyrosine normalized to total immunoprecipitated ACTN4 protein. (D, E) eGFP-tagged proteins from NR6WT fibroblasts transfected transiently with indicated plasmid(s) were immunoprecipitated and immunoblotted with indicated antibodies. Stained membrane means the PVDF membrane was stained with Coomassie G250 after immunoblotting. (F) Immunoblotting of indicated proteins from melanoma cell line WM1158 transiently transfected with either control or Tyro3 siRNA for 48h. (G) Cell migration speed of WM1158 transient transfected with either control or validated Tyro3 for 48h was determined with a standard scratch assay. (H) Cell invasion of M1158 transient transfected with either control or validated Tyro3 for 48h was determined using Matrigel invasion chamber assay. Shown is the representative image of at least three independent experiments. Data are mean ± SD of three independent experiments. Statistical analysis was performed using Student’s t-test. * P < 0.05, **p < 0.01.