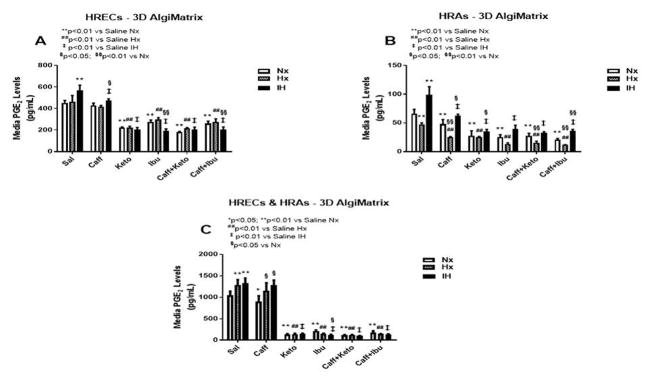
Figure 4.
PGE2 levels in media from 3-D AlgiMatrix biodegradable hydrogel scaffolds. Panel A represents data from HRECs, panel B from HRAs and panel C from co-cultures of HRECs+HRAs. Data are presented as mean±SEM (n=8 samples/groups). Data are presented as mean±SEM (n=8 samples/groups). Comparison to saline Nx is represented by *p<0.05; **p<0.01; comparison to saline Hx is represented by #p<0.05; ##p<0.01; comparison to saline IH is represented by †p<0.05; p<0.01; and comparison among the treated groups is represented by §p<0.05; §§p<0.01.

