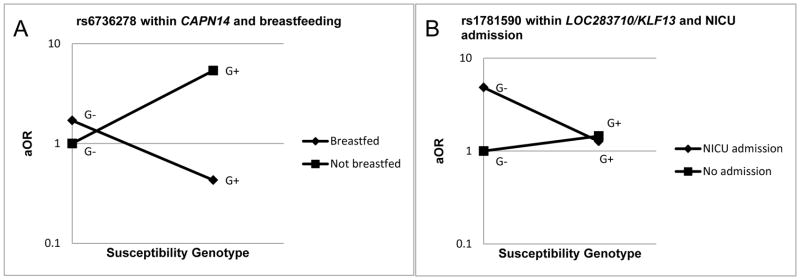
Figure 2.
Case-control analysis interaction plots for early life factors and susceptibility genotype
Plots denote interaction between selected exposures and genotype variants in the case-control analyses. Interaction models include adjustment for maternal education. G+=exposed to susceptibility genotype variant; G−=unexposed to susceptibility genotype variant. Figure A illustrates the difference in risk for those breastfed and not breastfed, among those with the susceptibility genotype variant. Figure B illustrates the increase in risk for NICU admission and those without the susceptibility variant.

