
Extended Data Fig. 11. Analysis of autophagic flux with V-9302 exposure.
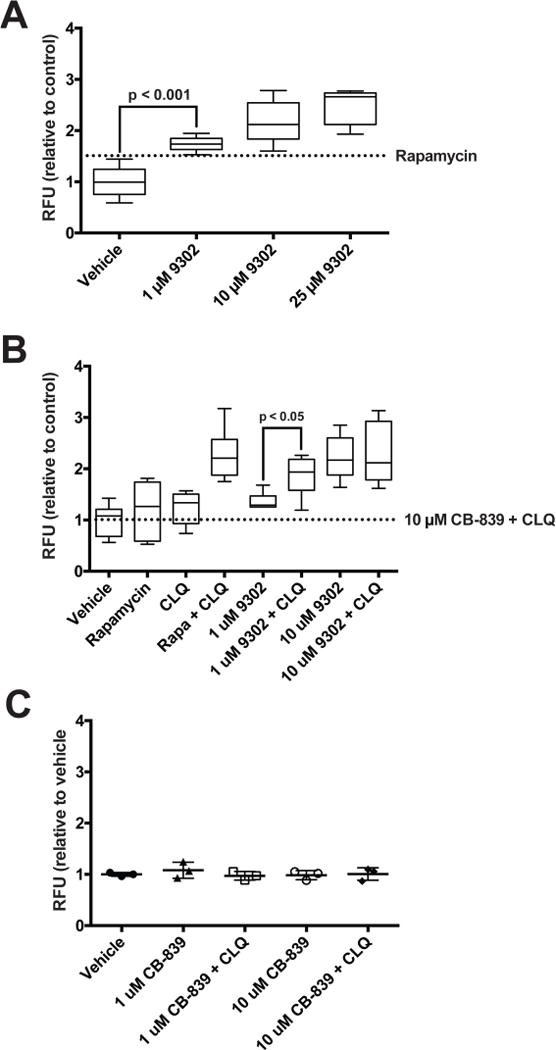
(A) Autophagic vesicles in HCC1806 cells with exposure to increasing concentrations of V-9302; 8 h treatment duration, concentrations shown; n = 3 independent experiments. P values determined by Student’s t test. Vesicles induced by rapamycin (dotted line, 500 nM, positive control). Combination of lysosomal inhibitor chloroquine (10 µM) and V-9302. (B) or CB-839 (C) in HT29 cells. CLQ = chloroquine. n = 3 independent experiments. P values determined by Student’s t test. For box plots, center line is plotted at the median; the box spans from the first quartile to the third quartile; whiskers represent min to max. Error bars represent ± std. dev.