
Extended Data Fig. 17. Evaluation of V-9302 in vivo in HCC1806 cell line xenograft-bearing mice.
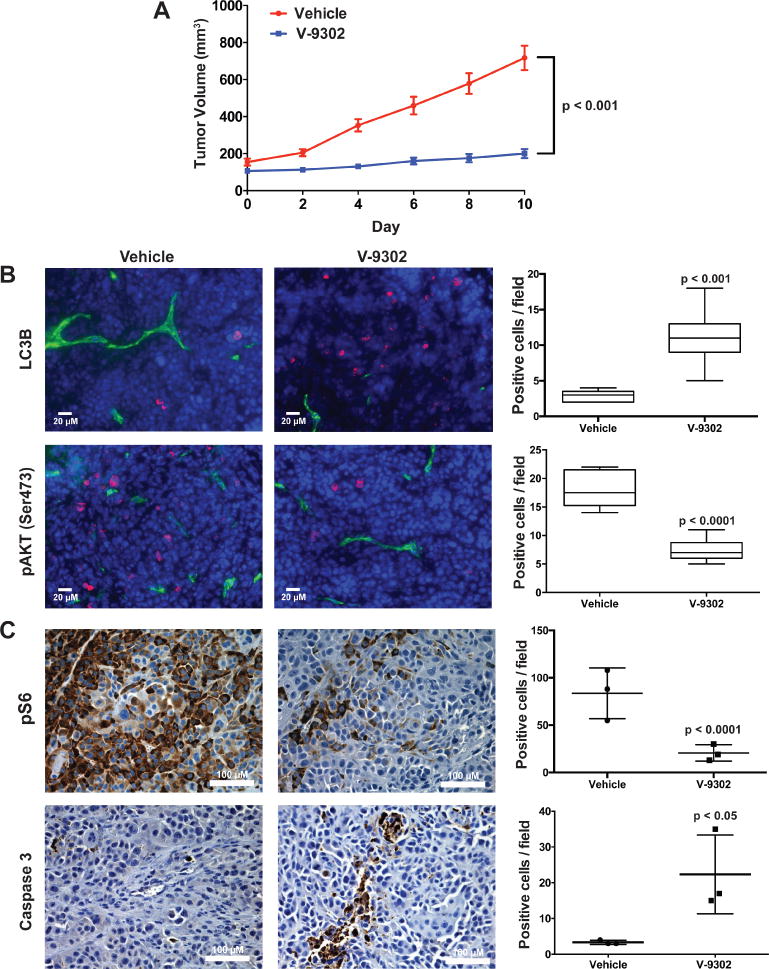
(A) Tumor volumetric analysis of mice treated with vehicle or V-9302 (75 mg/kg per day) for 10 days. n = 5 mice per group. Treatment started 9 days post injection. P value at day 10 determined by Student’s t test. (B) Immunofluorescence analysis of tumor tissues harvested from vehicle- or V-9302-treated mice; LC3B and pAKT (Ser473) shown (pink). CD-31 positive vessels shown in green and nuclei in blue (DAPI). 20× magnification. P values determined by Student’s t test. (C) Effects of V-9302 treatment on pS6-positive cells and caspase 3-positive cells by immunohistochemistry. Quantitative analysis consisted of the mean counts of at least three representative fields from three vehicle and three V-9302-treated mice. For box plots, center line is plotted at the median; the box spans from the first quartile to the third quartile; whiskers represent min to max. Error bars represent ± std. dev.