
Figure 4. Molecular determinants of ASCT2-antagonism in vitro.
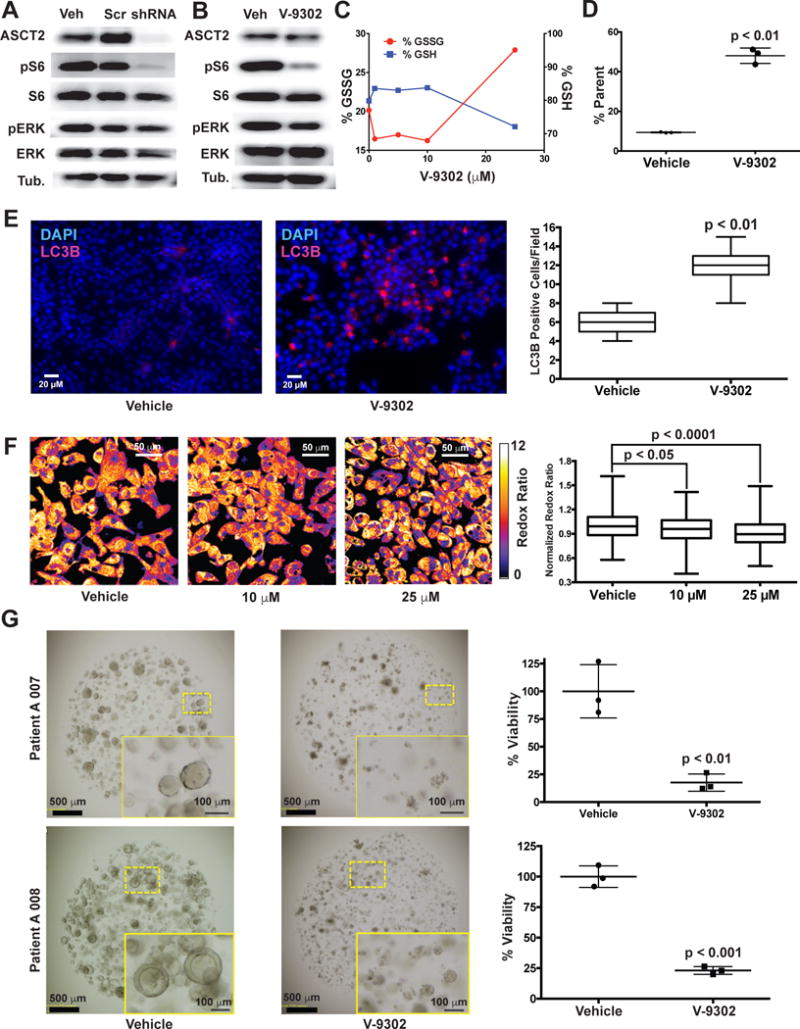
(A) Silencing ASCT2 (shRNA; HCC1806 cells; immunoblot shown) resulted in significantly attenuated pS6 and modestly decreased pERK. (B) V-9302 exposure (25 µM, 48 hrs) exhibited a similar inhibition profile to silencing ASCT2 with shRNA in HCC1806 cells. Uncropped gel images are provided in Supplementrary Fig. 2. (C) V-9302-dependent increase in oxidized glutathione (GSSG, left y-axis) and depletion of reduced glutathione (GSH, right y-axis) and (D) corresponding assay of reactive oxygen species (ROS); HCC1806 cells; n = 3 independent experiments. P < 0.01 by Student’s t test. (E) Effect of V-9302 exposure (25 µM, 48 hrs) on LC3B, a marker of autophagy, in HCC1806 cells. Immunofluorescence photomicrographs (left panels) showing cellular LC3B localization (pink fluorescence). Quantified numbers of LC3B-positive cells per field shown in right panel; n = 3 independent experiments. P < 0.01 by Student’s t test. Magnification 40×. (F) Effect of V-9302 exposure on optical redox-ratio ([FAD]/[NAD(P)H]) in HCC1806 cells. Representative photomicrographs (left) and quantification (right); concentrations shown, 48 hr exposure; n = 3 independent experiments. P values determined by Student’s t test. Magnification 40×. (G) Effects of V-9302 exposure (25 µM, 96 hrs) on the viability of two human colorectal cancer organoids (A007 - BRAFV600E; A008 - KRASG12V;p53R248Q;PTENL140Y.) Representative brightfield photomicrographs (left) and quantified organoid viability (right); n = 3 independent experiments. P values determined by Student’s t test. Error bars represent ± std. dev. For box plots, center line is plotted at the median; the box spans from the first quartile to the third quartile; whiskers represent min to max.