
Figure 5. Evaluation of V-9302 in vivo.
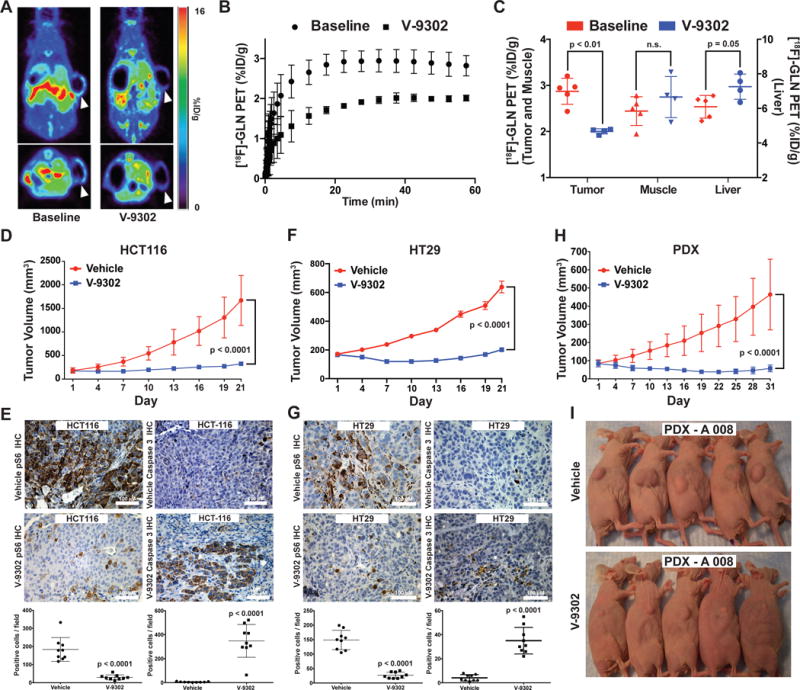
(A) Pharmacodynamic [18F]-4F-Gln PET imaging prior to and 4 h following a single administration of V-9302 (75 mg/kg) in HCC1806 cell line xenograft-bearing mice (arrows indicate xenograft tumor on right flank*). (B) Mean time activity curves (TACs) from tumor regions of interest (n = 4 measurements per condition); data prior to and 4 hrs following V-9302 administration. (C) P values determined by Student’s t test. Quantified tracer accumulation in xenograft tumors, muscle, and liver (n = 4 measurements per condition). Volumetric analysis over 21 day treatment regimen (Vehicle or V-9302; 75 mg/kg, daily) of HCT-116 (D) and HT29 (F) cell line xenografts propagated in athymic nude mice (n = 10 mice per group). Treatment started 12 days post tumor injection for HCT-116 and 4 days post injection for HT29. P values on day 21 determined by Student’s t test. Immunohistochemistry for pS6 and caspase 3 in vehicle-treated or V-9302-treated HCT-116 (E) and HT29 (G) xenografts. Representative photomicrographs and quantitation shown; magnification 20×. P values determined by Student’s t test. (H) Volumetric analysis over 31 day treatment regimen (Vehicle or V-9302; 75 mg/kg, daily) on athymic nude mice bearing patient-derived xenograft tumors (PDX A 008, F3 generation, treatment started 28 days post implantation, KRASG12V;p53R248Q;PTENL140Y ; n = 10 mice per group) P value on day 31 determined by Student’s t test. (I) Photographs of A 008 PDX-bearing mice treated with V-9302 or vehicle; day 16 of 31. (Error bars represent ± std. dev. *Central photopenia observed.