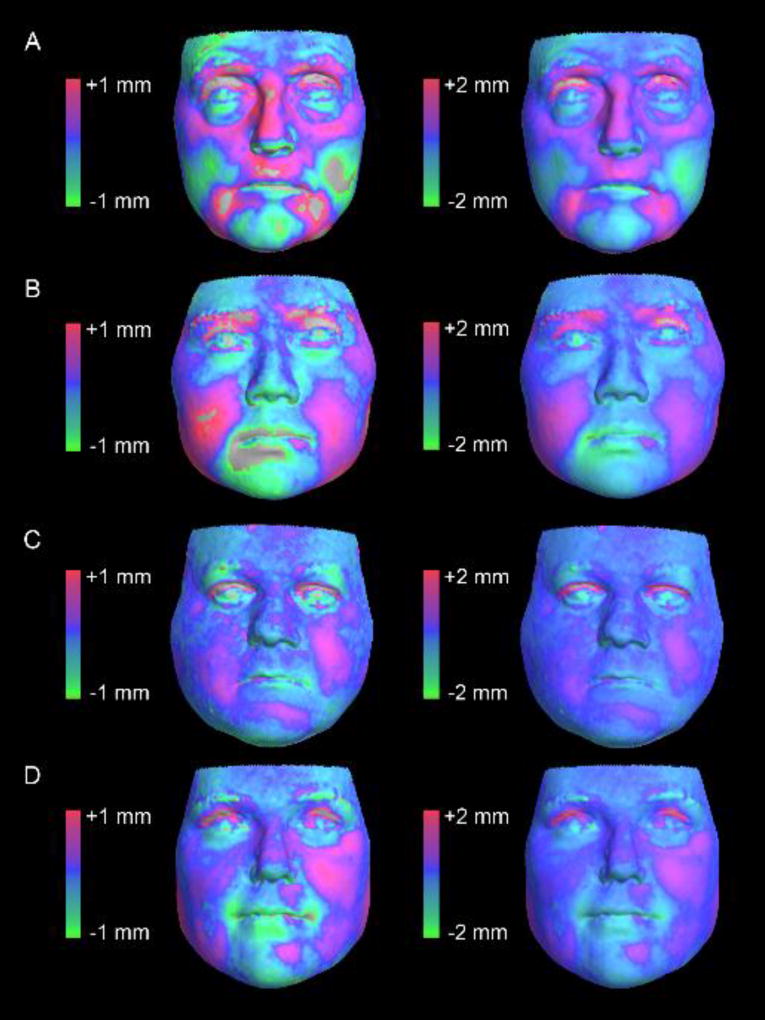
Fig. 3.
Heat maps showing surface-to-surface deviations following the registration of 3D models generated from the Vectra H1 and 3dMDface camera systems on four live participants. The faces at the top (A, B) had root mean square (RMS) values at the high end of those observed (0.59 mm and 0.54 mm, respectively). The faces at the bottom (C, D) had RMS values at the low end of those observed (0.33 mm and 0.33 mm, respectively). Faces in the first column show heat maps with a ±1 mm threshold. This threshold was relaxed to ±2 mm for faces in the second column. Colors at the red end of the spectrum indicate locations where the Vectra H1 surfaces show outward displacement relative to the 3dMDface surfaces. Colors at the green end of the spectrum show inward displacement. Blue tones indicate areas of no difference. Regions where surface-to-surface differences exceed the ±1 mm or ±2 mm thresholds are indicated in grey. Note that the vast majority of the surface differences fall within the upper and lower bounds of the error thresholds. Heat maps for all 26 participants are available in the Supplementary Material (Figs. S1 and S2).

