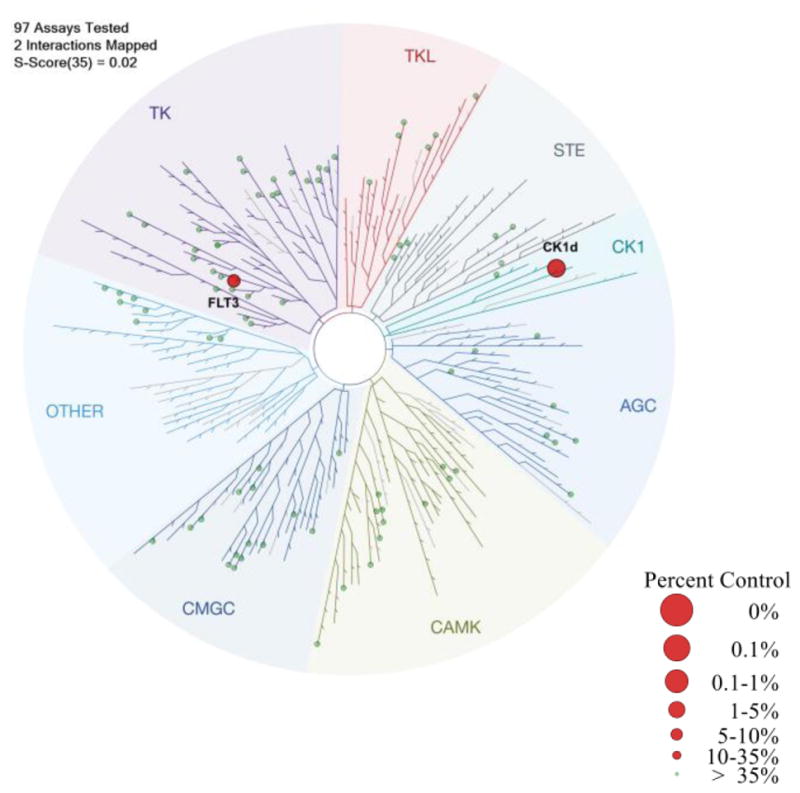
Figure 4.

Dendrogram presentation of results of DiscoverRX scanEDGE kinase binding selectivity analysis of compound 17. Data are presented for all kinases that have <35% control activity at 10 μM (% control is the percentage of kinase remaining bound to the bead-bound active-site ligand in the presence of the inhibitor), represented as red circles on kinome tree and >35% control activity 10 μM, represented as green circles.
