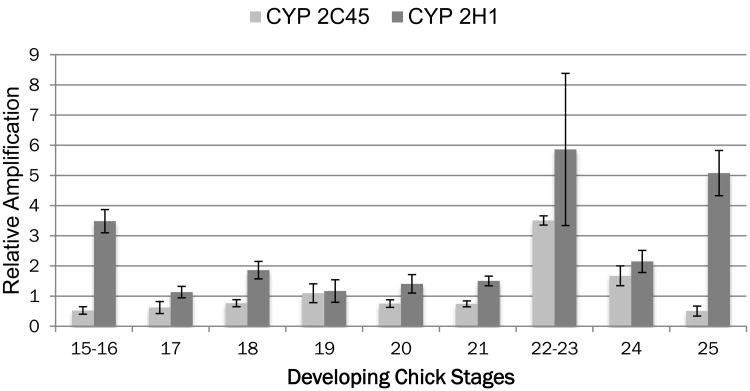
Figure 3.
Expression of Cytochrome P450 genes in the developing heart. The staged comparison of CYP gene expression shows both an early peak of expression by CYP2H1 and again between stages 22 and 25. In contrast, CYP2C45 peaks at stage 22-23. While neither pattern matches expression of HNF4a, the pattern of CYP2C45 is closest of the two. Measurements are made from the same sample pools as shown in Fig. 2 and are normalized to expression observed at stage 19 for each gene. Error bars reflect the S.E.M.

